
Page Contents
- Overview
- Installing
- Basic Usage
- Examples
- Basic Line Plot
- Line Plots with Equations
- Argand Diagram
- Scatter Plot: No Lines
- Inverted and With Hidden Axes: Rendering Characters!
- Rendering Cubes using Matplotlib and NumPy
- Rendering 3D Conway Cubes Animation, With NumPy and 3D Scatter
- 2D Hexagons Animation
- 2D Migration Animation
- Rendering an Animated Snake with Scatter
- Visualising a Path Through a Maze
- Another Grid Visualisation
- Plotting Trajectories
- Plotting 3D Beacons
- Plotting a 2D grid from NumPy, with Legend
- Plotting and Filling a Polygon
- Plotting a Perimeter and Marking Contained Points
- Creating Squares Around Points
- Animating with Matplotlib
- Going Beyond Matplotlib
- Seaborn
Overview
Visualisation is a superpower. Whether you’re debugging a complex algorithm or just want to show off your solution on Reddit, a good chart (or animation) is worth a thousand print() statements.
In this guide, we’ll look at the industry standard—Matplotlib—for creating static, animated, and interactive visualisations. But we won’t stop there. We’ll also look at how to create retro console animations using Rich, and how to stitch images together into GIFs using Pillow.
So… grab a piña colada, fire up your IDE, and let’s get visual!
Installing
uv add matplotlib
Basic Usage
- Many of the basic capabilities you’ll need are exposed through the
pyplot. So the first thing you’ll want to do is importpyplot. - Visualisations are created on
figures, which in turn contain one or moreaxes; i.e. an individual plot area.
Getting Axes
Here are a few ways to obtain axes for plotting on:
from matplotlib import pyplot as plt

fig, axes = plt.subplots()

# or with 'get current axes'
axes = plt.gca()

# to set all axes to use equal aspects, rather than auto...
axes.set_aspect('equal', adjustable='box')
Showing the Visualisation
# To show interactively, i.e. pausing code execution until the window is closed
plt.show()
Grid Lines and Axis Limits
# add grid lines
axes.grid(True)

# set the limits for each axis
axes.set_xlim(-4, 4)
axes.set_ylim(-4, 4)
axes.set_xlabel("real")
axes.set_ylabel("imag")

plt.show()
The output looks like this:
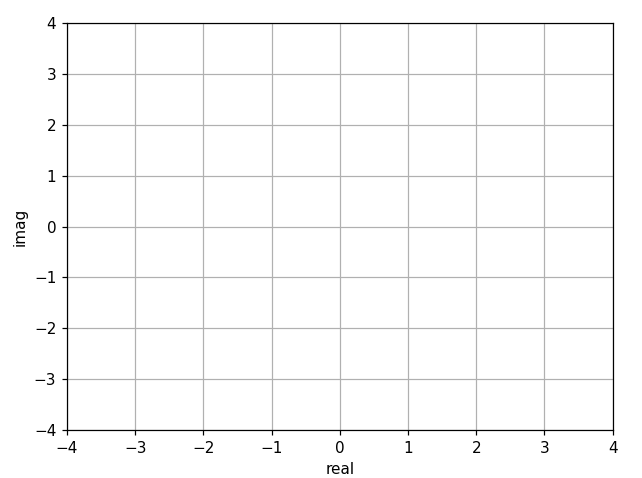
Of course, there’s no data yet.
Saving the Visualisation to a File
Instead of rendering the visualisation interactively, we can instead save it. This is easy to do. Instead of using plt.show(), we use plt.savefig() and pass in the file we want to save to.
# Save visualisation to a file
plt.savefig("myfile.jpg")

# With a transparent background
plt.savefig("myfile.jpg", transparent=True)
Maybe we want to save to a particular folder, and create that folder if it doesn’t already exit:
from pathlib import Path

SCRIPT_DIR = Path(__file__).parent            # working directory
OUTPUT_DIR = Path(SCRIPT_DIR, "output/")      # where we want to put our new file
OUTPUT_FILE = Path(OUTPUT_DIR, "my_vis.png")  # the name of our new file

if not Path.exists(OUTPUT_DIR):               # Create folder if it doesn't exist
    Path.mkdir(OUTPUT_DIR)
plt.savefig(OUTPUT_FILE)
Examples
The next few examples will start with this:
from matplotlib import pyplot as plt

fig, axes = plt.subplots()

# add grid lines
axes.grid(True)
axes.set_xlabel("x")
axes.set_ylabel("y")
Basic Line Plot
# create list of points
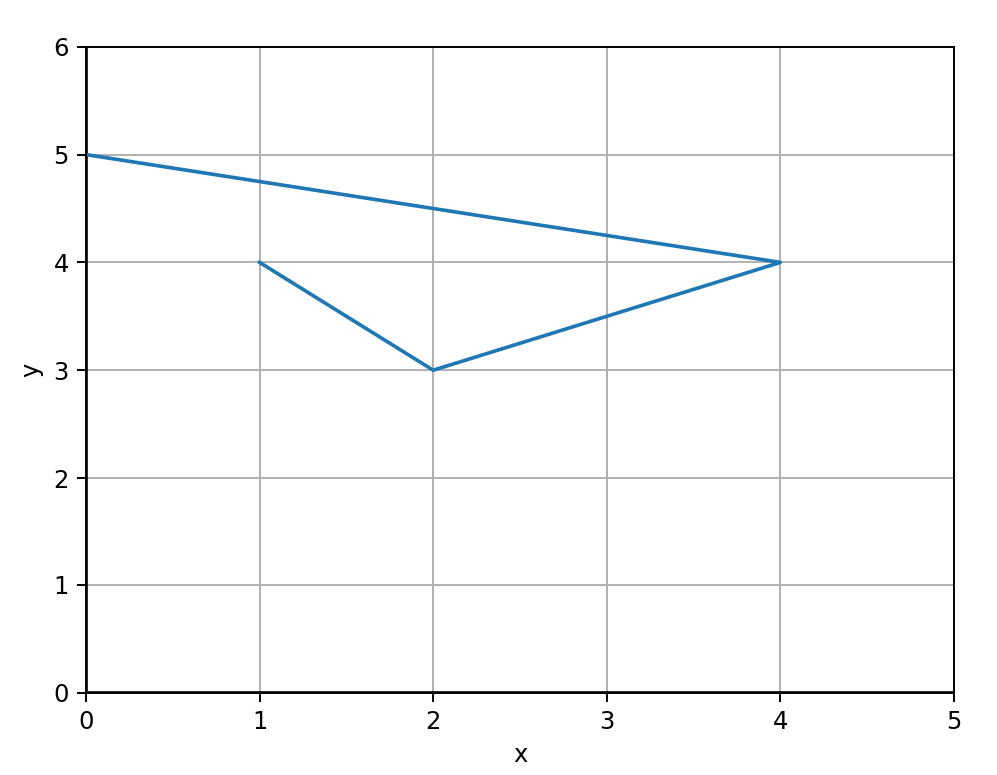
points = [ (1, 4), (2, 3), (4, 4), (0, 5) ]

# Unpack our x, y vals
all_x, all_y = zip(*points)

# Create out axes
fig, axes = plt.subplots()

# add lines at x=0, y=0 and labels
plt.axhline(0, color='black')
plt.axvline(0, color='black')
axes.set_xlim(0, max(all_x)+1)
axes.set_ylim(0, max(all_y)+1)
axes.set_xlabel("x")
axes.set_ylabel("y")

# add grid lines
axes.grid(True)

plt.plot(all_x, all_y)
plt.show()
Output:
Line Plots with Equations
x = np.linspace(0, 2, 100) # Generate a numpy array of data to plot

fig, ax = plt.subplots()  # Create a figure and an axes
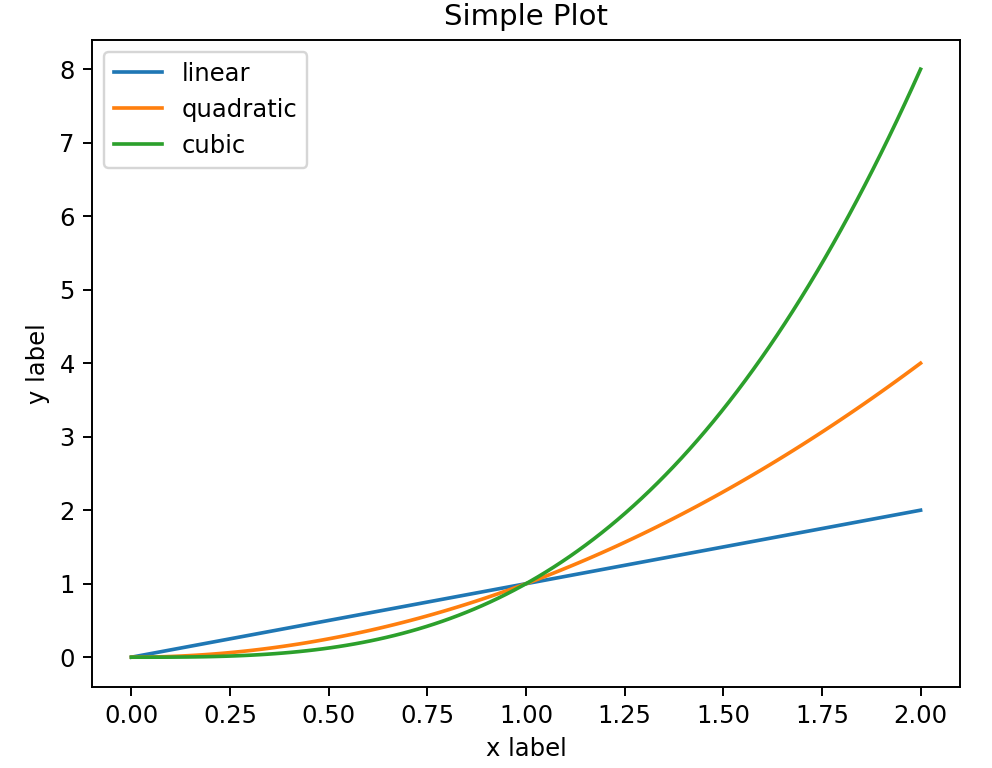
ax.plot(x, x, label='linear')  # Plot some data on the axes
ax.plot(x, x**2, label='quadratic')  # Plot more data on the axes...
ax.plot(x, x**3, label='cubic')  # ... and some more.
ax.set_xlabel('x label')  # Add an x-label to the axes.
ax.set_ylabel('y label')  # Add a y-label to the axes.
ax.set_title("Simple Plot")  # Add a title to the axes.
ax.legend()  # Add a legend.

plt.show()
Output:
Argand Diagram
def cw_rotate(z: complex, degrees: float) -> complex:
    """ Returns a new point, after rotating the supplied point about the origin, clockwise.

    Args:
        z (complex): Point to rotate
        degrees (float): Degrees to rotate, CW

    Returns:
        complex: A new points
    """
    # Note that complex number phase is expressed as a CCW angle to the real axis.
    # Thus, to rotate CW, we have to always take the supplied angle from 360.
    return z * 1j**((360-degrees)/90)

points: list[complex] = [] # store our points

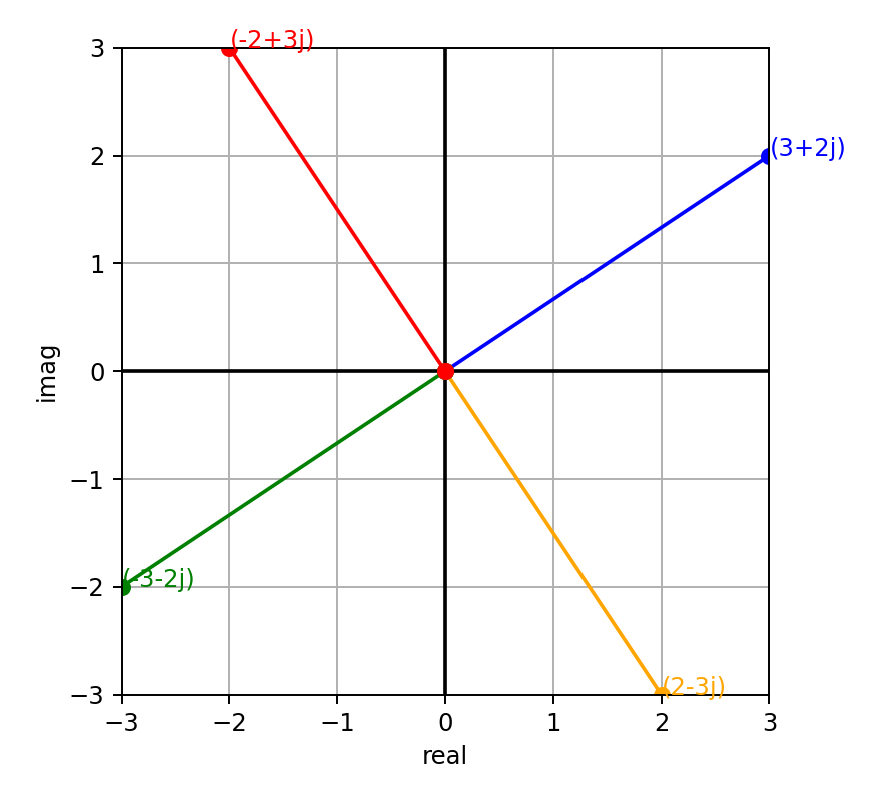
POINT = 3+2j # starting point
print(POINT)
points.append(POINT)

for cw_angle in (90, 180, 270):
    rotated_point = cw_rotate(POINT, cw_angle)
    points.append(rotated_point)

fig, axes = plt.subplots()  # Create out axes
axes.set_aspect('equal') # set x and y to equal aspect
axes.grid(True) # add grid lines

# add lines at x=0, y=0
plt.axhline(0, color='black')
plt.axvline(0, color='black')

# set the limits and labels for each axis
all_x = [num.real for num in points]
all_y = [num.imag for num in points]
axes.set_xlim(min(all_x), max(all_x))
axes.set_ylim(min(all_y), max(all_y))
axes.set_xlabel("real")
axes.set_ylabel("imag")

colours = ['blue', 'orange', 'green', 'red']

# Iterate over each point and plot
for i, point in enumerate(points):
    # For this point, plot from origin to the point
    plt.plot([0, point.real], [0, point.imag], '-', marker='o', color=colours[i])

    # Add an annotation to the point.  We can do this one of two ways...
    # plt.text(point.real, point.imag, str(point))
    plt.annotate(str(point), (point.real, point.imag), color=colours[i])

plt.show()
Output:
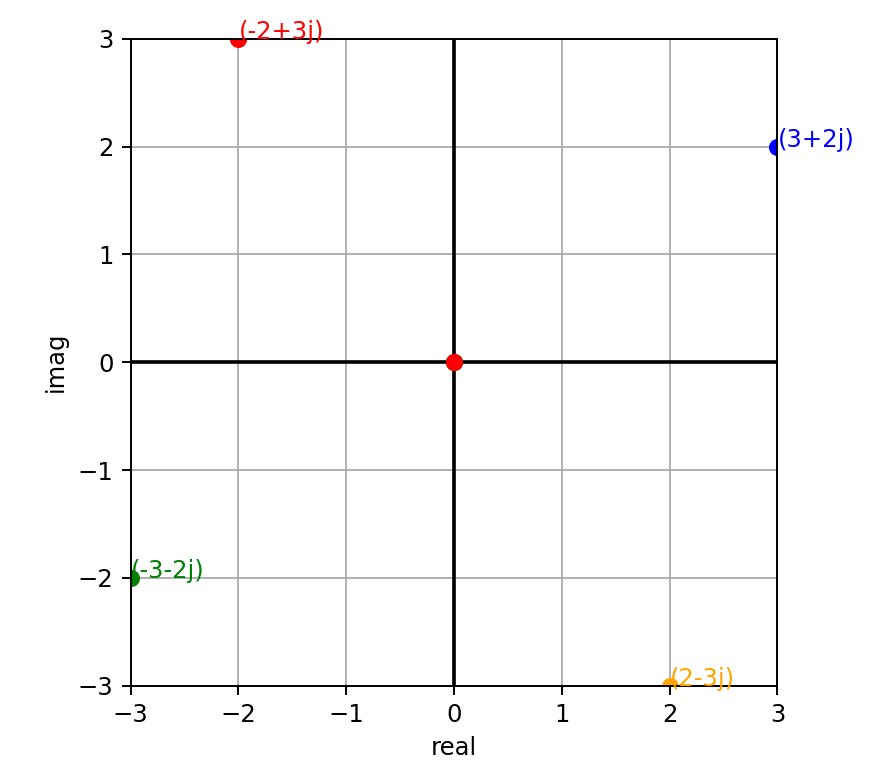
Scatter Plot: No Lines
We can amend one line above and use the format string parameter to remove the lines, as follows:
plt.plot([0, point.real], [0, point.imag], 'o', color=colours[i])
Inverted and With Hidden Axes: Rendering Characters!
Imagine we have a number of (x,y) coordinates defined in a set of point objects called dots. We can render them in a cool way, like this:
""" Render these coordinates as a scatter plot """
all_x = [point.x for point in dots]
all_y = [point.y for point in dots]

axes = plt.gca()
axes.set_aspect('equal')
plt.axis("off") # hide the border around the plot axes
axes.set_xlim(min(all_x)-1, max(all_x)+1)
axes.set_ylim(min(all_y)-1, max(all_y)+1)
axes.invert_yaxis()

axes.scatter(all_x, all_y, marker="o", s=50)
plt.show()
Output:

Rendering Cubes Using Matplotlib and NumPy
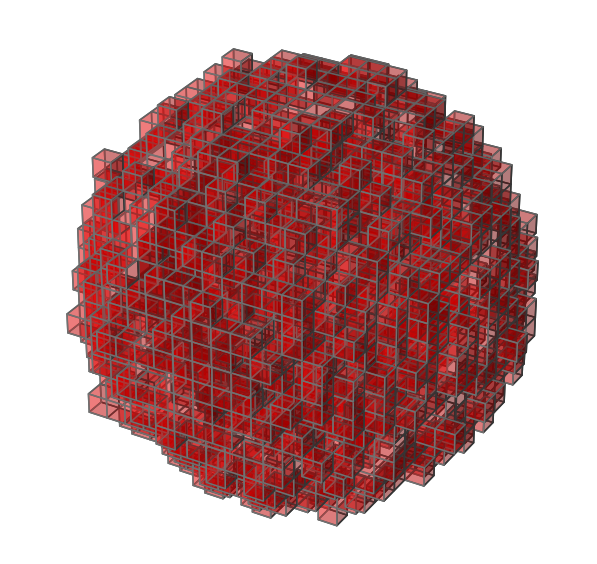
Here’s an example that renders 3D cubes based on a set of 3D coordinates:
    def vis(self):
        """ Render a visualisation of our droplet """

        axes = [self._max_x+1, self._max_y+1, self._max_z+1]  # set bounds
        grid = np.zeros(axes, dtype=np.int8)   # Initialise 3d grid to empty
        for point in self.filled_cubes:  # set our array to filled for all filled cubes
            grid[point.x, point.y, point.z] = 1

        facecolors = np.where(grid==1, 'red', 'black')

        # Plot figure
        fig = plt.figure()
        ax = fig.add_subplot(111, projection='3d')
        ax.voxels(grid, facecolors=facecolors, edgecolors="grey", alpha=0.3)
        ax.set_aspect('equal')
        plt.axis("off")
        plt.show()
The code above is taken from my 2022 Day 18 solution. The rendered image looks like this:
Rendering 3D Conway Cubes Animation, With NumPy and 3D Scatter
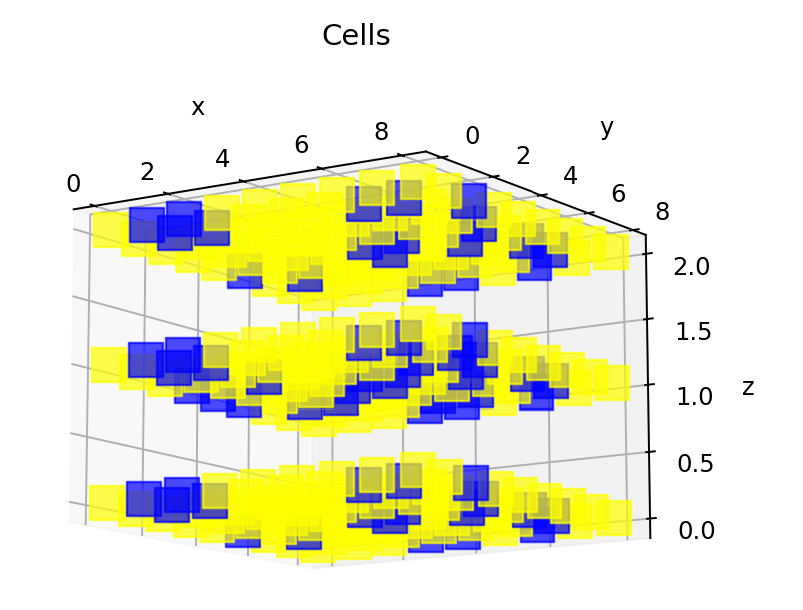
Taken from 2020 Day 17: Conway Cubes:
def show_grid(grid):
    x_vals = [cell.get_x() for cell in grid]
    y_vals = [cell.get_y() for cell in grid]
    z_vals = [cell.get_z() for cell in grid]

    min_x_add = 0
    min_y_add = 0
    min_z_add = 0

    min_x = min(x_vals)
    min_y = min(y_vals)
    min_z = min(z_vals)

    # we need to get rid of negative coords, since numpy doesn't support -ve values for indexes
    if min_x < 0:
        min_x_add = 0 - min_x
    if min_y < 0:
        min_y_add = 0 - min_y
    if min_z < 0:
        min_z_add = 0 - min_z

    x_size = (max(x_vals) + 1) - min(x_vals)
    y_size = (max(y_vals) + 1) - min(y_vals)
    z_size = (max(z_vals) + 1) - min(z_vals)
    xyz = np.zeros((x_size, y_size, z_size))
    for cell in grid:
        x = cell.get_x() + min_x_add
        y = cell.get_y() + min_y_add
        z = cell.get_z() + min_z_add

        xyz[x, y, z] = 1

    axes = plt.axes(projection='3d')
    for index, active in np.ndenumerate(xyz):
        if active == 1:
            axes.scatter3D(*index, c='blue', marker='s', s=200, alpha=0.7)
        else:
            axes.scatter3D(*index, c='yellow', marker='s', s=200, alpha=0.7)

    axes.set_xlabel('x')
    axes.set_ylabel('y')
    axes.set_zlabel('z')
    axes.set_title('Cells')

    plt.show()
2D Hexagons Animation
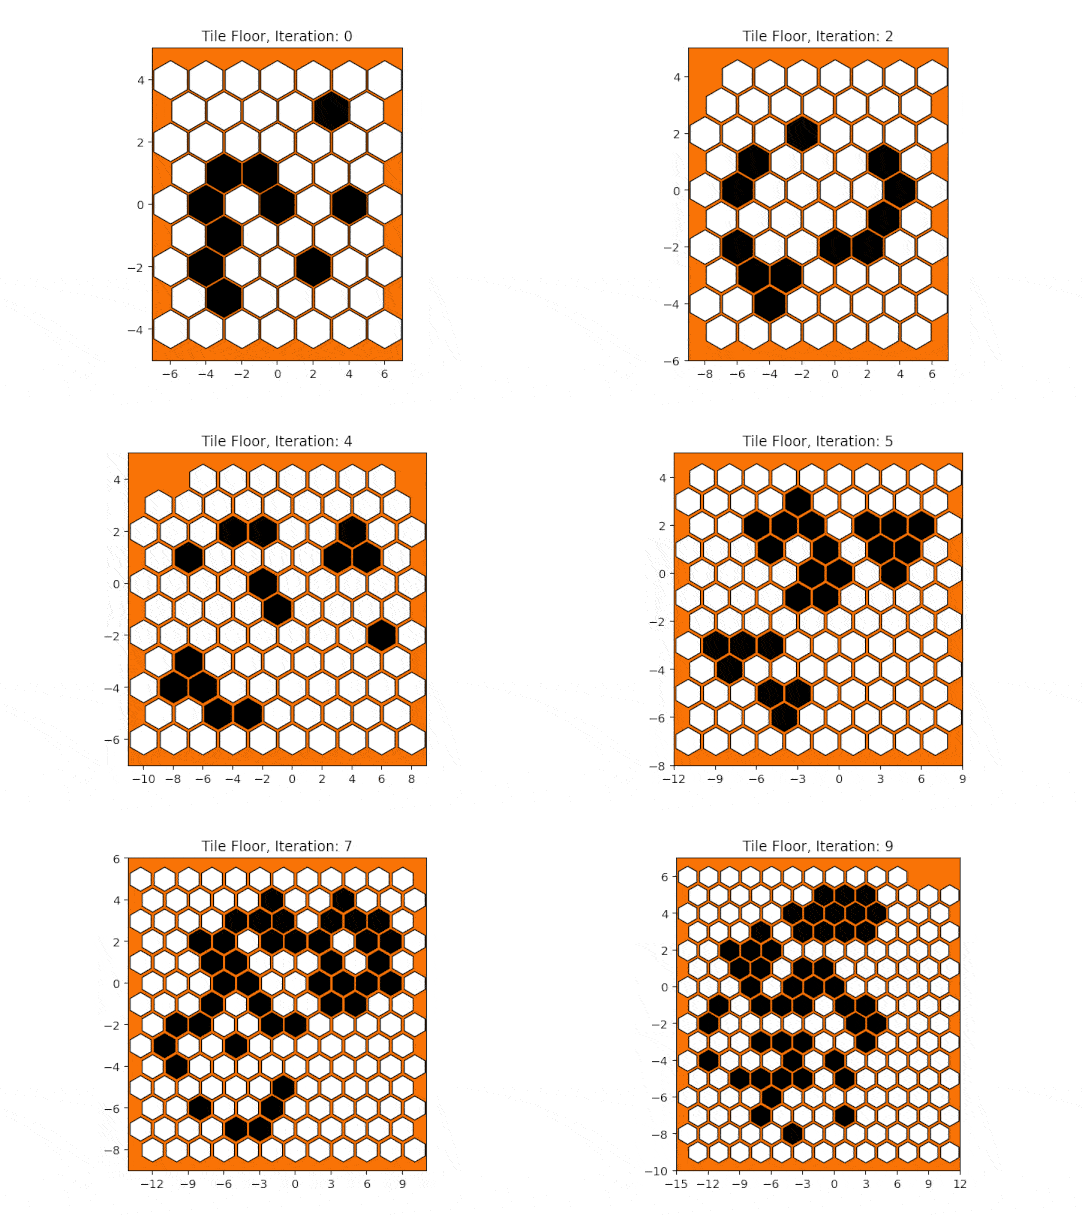
Taken from 2020 Day 24: Hexagons and Neighbours:
def vis_state(black_tiles, all_tiles, iteration):
    white_tiles = all_tiles.difference(black_tiles)

    all_x, all_y = zip(*all_tiles)
    white_x, white_y = zip(*white_tiles)
    black_x, black_y = zip(*black_tiles)

    min_x, max_x = min(all_x), max(all_x)
    min_y, max_y = min(all_y), max(all_y)

    # hexagon!
    shape = 'h'

    fig, ax = plt.subplots(dpi=141)
    ax.set_facecolor('xkcd:orange')
    ax.set_xlim(min_x-1, max_x+1)
    ax.set_ylim(min_y-1, max_y+1)

    # we want x axis compressed, given our hex geometry.
    # I.e. given that e or w = 2 units.
    ax.set_aspect(1.75)

    # dynamically compute the marker size
    fig.canvas.draw()
    mkr_size = ((ax.get_window_extent().width / (max_x-min_x) * (134/fig.dpi)) ** 2)

    # make sure the ticks have integer values
    ax.xaxis.set_major_locator(MaxNLocator(integer=True))

    ax.scatter(black_x, black_y, marker=shape, s=mkr_size, color='black', edgecolors='black')
    ax.scatter(white_x, white_y, marker=shape, s=mkr_size, color='white', edgecolors='black')
    ax.set_title(f"Tile Floor, Iteration: {iteration-1}")

    output_dir = Path(OUTPUT_DIR)
    output_dir.mkdir(parents=True, exist_ok=True)

    # save the plot as a frame
    filename = output_dir / f"tiles_anim_{iteration}.png"
    plt.savefig(filename)
    # plt.show()
    anim_frame_files.append(filename)
2D Migration Animation
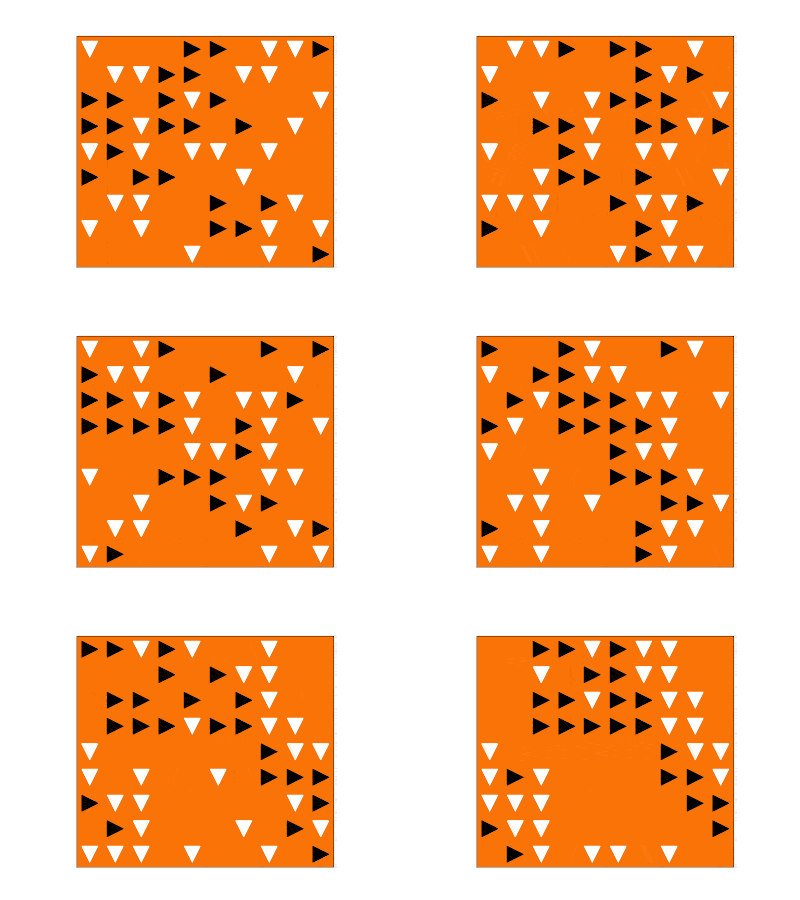
Taken from 2021 Day 25: Migrating Sea Cucumbers:
    def _render_frame(self):
        """ Only renders an animation frame if we've attached an Animator """
        if not self._animator:
            return

        east = set()
        south = set()

        for y in range(self._grid_len):
            for x in range(self._row_len):
                if self._grid[y][x] == ">":
                    east.add((x,y))
                elif self._grid[y][x] == "v":
                    south.add((x,y))

        east_x, east_y = zip(*east)
        south_x, south_y = zip(*south)

        axes, mkr_size = self._plot_info

        axes.clear()
        min_x, max_x = -0.5, self._row_len - 0.5
        min_y, max_y = -0.5, self._grid_len - 0.5
        axes.set_xlim(min_x, max_x)
        axes.set_ylim(max_y, min_y)

        axes.scatter(east_x, east_y, marker=">", s=mkr_size, color="black")
        axes.scatter(south_x, south_y, marker="v", s=mkr_size, color="white")

        # save the plot as a frame; store the frame in-memory, using a BytesIO buffer
        frame = BytesIO()
        plt.savefig(frame, format='png') # save to memory, rather than file
        self._animator.add_frame(frame)

    def setup_fig(self):
        if not self._animator:
            return

        my_dpi = 120
        fig, axes = plt.subplots(figsize=(1024/my_dpi, 768/my_dpi), dpi=my_dpi, facecolor="black") # set size in pixels

        axes.get_xaxis().set_visible(False)
        axes.get_yaxis().set_visible(False)
        axes.set_aspect('equal') # set x and y to equal aspect
        axes.set_facecolor('xkcd:orange')

        min_x, max_x = -0.5, self._row_len - 0.5
        min_y, max_y = -0.5, self._grid_len - 0.5
        axes.set_xlim(min_x, max_x)
        axes.set_ylim(max_y, min_y)

        # dynamically compute the marker size
        fig.canvas.draw()
        mkr_size = ((axes.get_window_extent().width / (max_x-min_x) * (45/fig.dpi)) ** 2)
        return axes, mkr_size
Rendering an Animated Snake with Scatter
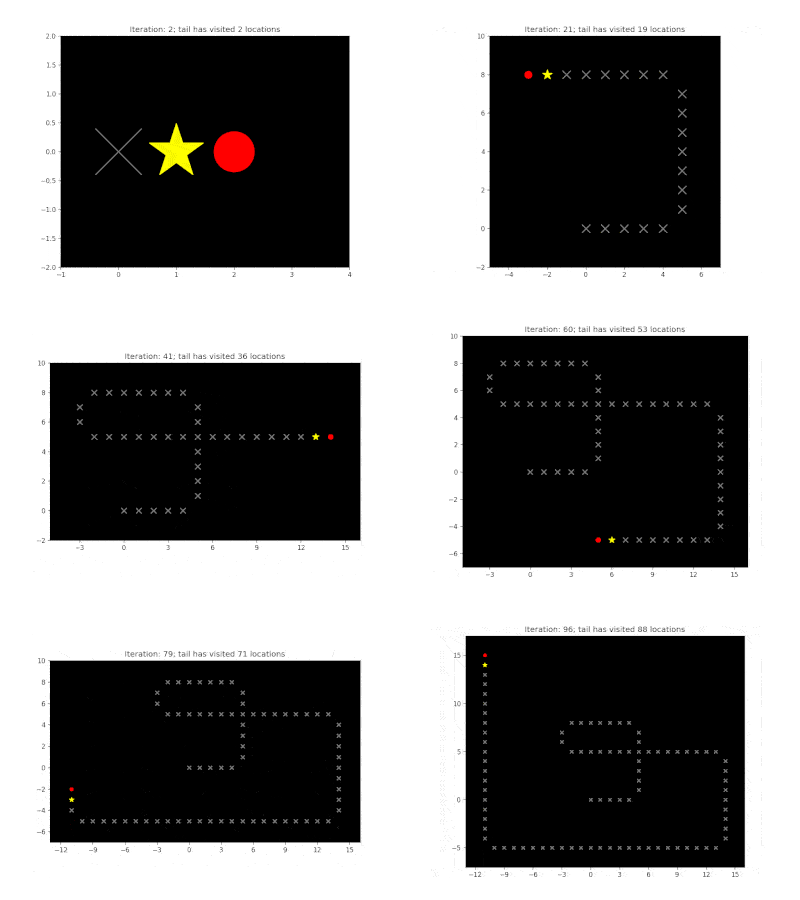
Taken from 2022 Day 09 - Rope Bridge:
    def _init_plt(self):
        """ Generate a Figure and Axes objects which are reused. """
        my_dpi = 120
        figure, axes = plt.subplots(figsize=(1024/my_dpi, 768/my_dpi), dpi=my_dpi, facecolor="white") # set size in pixels
        axes.set_aspect('equal') # set x and y to equal aspect
        axes.set_facecolor('xkcd:black')

        return figure, axes

    def _render_frame(self, visited: set[Point], iteration: int=0):
        """ Only renders an animation frame if we've attached an enabled Animator """

        fig, axes = self._plt_info
        axes.clear()

        # The grid will grow as the rope heads moves around
        max_x = max(self._all_head_locations, key=lambda point: point.x).x
        min_x = min(self._all_head_locations, key=lambda point: point.x).x
        max_y = max(self._all_head_locations, key=lambda point: point.y).y
        min_y = min(self._all_head_locations, key=lambda point: point.y).y
        axes.set_xlim(min_x - 2, max_x + 2)
        axes.set_ylim(min_y - 2, max_y + 2)

        # dynamically compute the marker size
        fig.canvas.draw()
        factor = 40  # Smaller factor means smaller markers
        mkr_size = int((axes.get_window_extent().width / (max_x-min_x+1) * (factor/fig.dpi)) ** 2)

        # make sure the ticks have integer values
        axes.xaxis.set_major_locator(MaxNLocator(integer=True))

        head = self._knots[0]
        tail = self._knots[-1]
        others_knots = self._knots[1:-1]

        visited_x = [point.x for point in visited if point != tail]
        visited_y = [point.y for point in visited if point != tail]

        for knot in others_knots:
            axes.scatter(knot.x, knot.y, marker=MarkerStyle("."), s=mkr_size/2, color="white")

        axes.scatter(head.x, head.y, marker=MarkerStyle("."), s=mkr_size, color="red")
        axes.scatter(visited_x, visited_y, marker=MarkerStyle("x"), s=mkr_size/3, color="grey")
        axes.scatter(tail.x, tail.y, marker=MarkerStyle("*"), s=mkr_size/2, color="yellow")

        axes.set_title(f"Iteration: {iteration}; tail has visited {len(visited)} locations")

        # save the plot as a frame; store the frame in-memory, using a BytesIO buffer
        frame = BytesIO()
        plt.savefig(frame, format='png') # save to memory, rather than file
        self._animator.add_frame(frame)
Visualising a Path Through a Maze
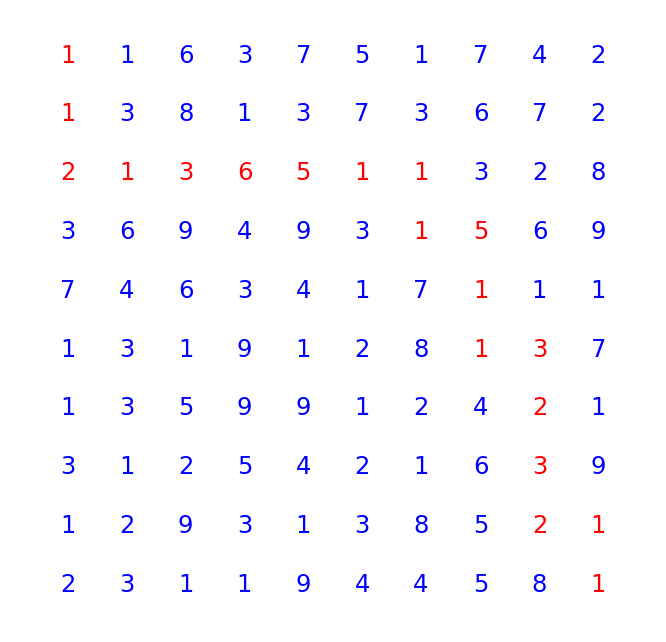
Taken from 2021 Day 15: Risk Maze:
def visualise_path(grid: Grid, path: list[tuple[Point, int]]):
    """ Render this paper and its dots as a scatter plot """
    all_x = [point.x for point in grid.all_points()]
    all_y = [point.y for point in grid.all_points()]
    labels = [grid.value_at_point(point) for point in grid.all_points()]
    path_points = [Point(0,0)] + [path_item[0] for path_item in path]

    axes = plt.gca()
    axes.set_aspect('equal')
    plt.axis("off") # hide the border around the plot axes
    axes.set_xlim(min(all_x)-1, max(all_x)+1)
    axes.set_ylim(min(all_y)-1, max(all_y)+1)
    axes.invert_yaxis()

    for point, label in zip(grid.all_points(), labels):
        if point in path_points:
            plt.text(point.x, point.y, s=str(label), color="r")
        else:
            plt.text(point.x, point.y, s=str(label), color="b")

    plt.show()
Another Grid Visualisation
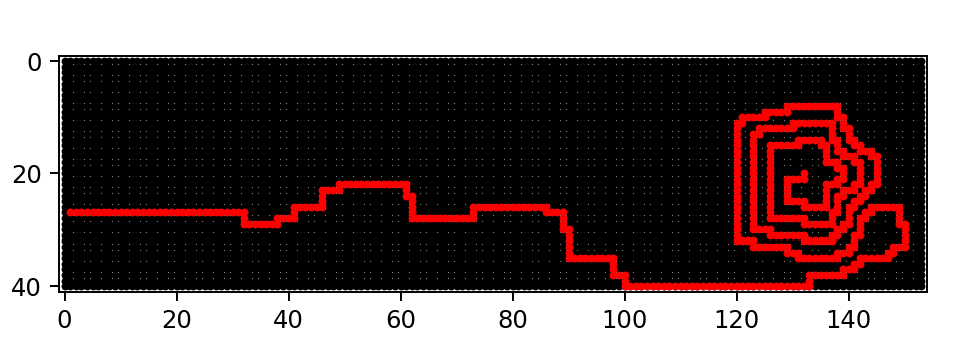
Taken from 2022 Day 12: Hill Climbing:
def render_as_plt(grid, path):
    """ Render the display as a scatter plot """
    x_vals = [point.x for point in grid.all_points()]
    y_vals = [point.y for point in grid.all_points()]

    path_x = [point.x for point in path]
    path_y = [point.y for point in path]

    axes = plt.gca()
    axes.set_aspect('equal')
    axes.set_xlim(min(x_vals)-1, max(x_vals)+1)
    axes.set_ylim(min(y_vals)-1, max(y_vals)+1)
    axes.invert_yaxis()

    axes.scatter(x_vals, y_vals, marker="o", s=5, color="black")
    axes.scatter(path_x, path_y, marker="o", s=5, color="red")
    plt.show()
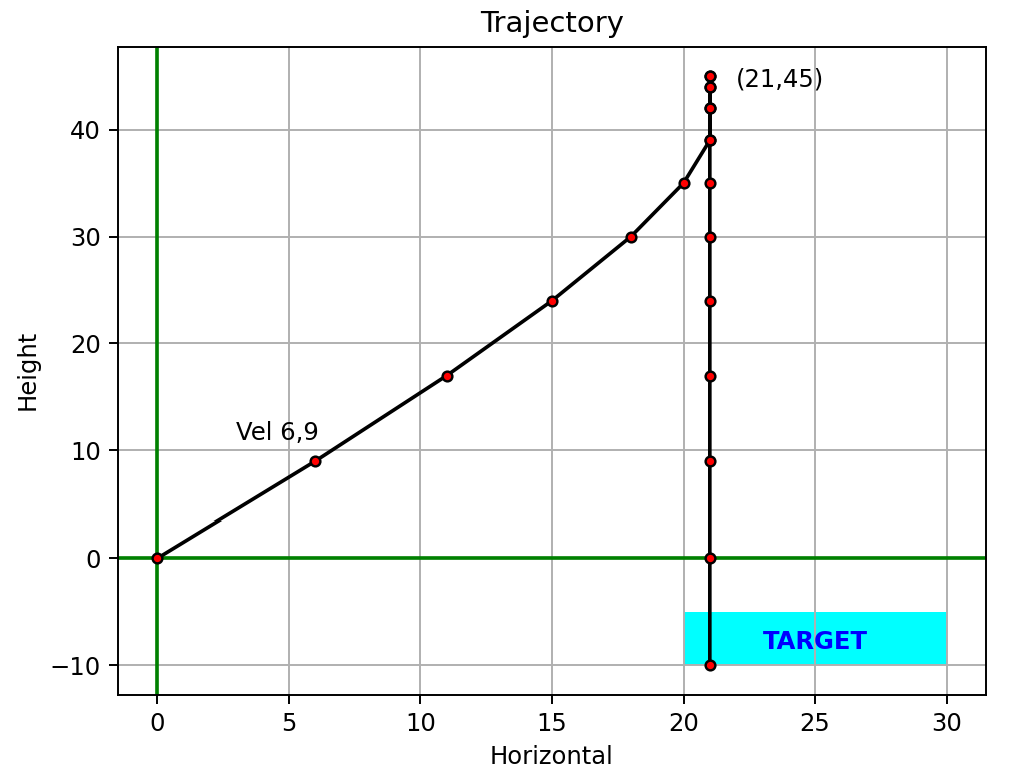
Plotting Trajectories
Taken from 2021 Day 17: Probe Trajectories:
def plot_trajectory(trajectory: list[Point], target: Rect, outputfile=None):
    """ Render this trajectory as a plot, and optionally save it """
    axes = plt.gca()

    # Add axis lines at x=0 and y=0
    plt.axhline(0, color='green')
    plt.axvline(0, color='green')
    axes.grid(True) # grid lines on

    # Set up titles
    axes.set_title("Trajectory")
    axes.set_xlabel("Horizontal")
    axes.set_ylabel("Height")

    axes.fill(*target.as_polygon(), 'cyan')  # add the target area
    plt.annotate("TARGET", (target.left_x, target.top_y),
                 xytext=(target.left_x + ((target.right_x - target.left_x)/2)-2,
                        (target.top_y - (target.top_y-target.bottom_y)/2)-1),
                 color="blue", weight='bold')

    # Plot the trajectory points
    all_x = [point.x for point in trajectory]
    all_y = [point.y for point in trajectory]
    plt.plot(all_x, all_y, marker="o", markerfacecolor="red", markersize=4, color='black')

    x, y = trajectory[1].x, trajectory[1].y
    plt.annotate(f"Vel {x},{y}", (x,y), xytext=(x-3, y+2))  # label first point
    x, y = [(point.x, point.y) for point in trajectory if point.y == max(point.y for point in trajectory)][0]
    plt.annotate(f"({x},{y})", (x,y), xytext=(x+1, y-1))  # label highest point

    if outputfile:
        dir_path = Path(outputfile).parent
        if not Path.exists(dir_path):
            Path.mkdir(dir_path)
        plt.savefig(outputfile)
        logger.info("Plot saved to %s", outputfile)
    else:
        plt.show()
Plotting 3D Beacons
Taken from 2021 Day 19: Beacons and Scanners:
def plot(scanner_locations: dict[int, Vector], beacon_locations: set[Vector], outputfile=None):
    _ = plt.figure(111)
    axes = plt.axes(projection="3d")
    axes.set_xlabel("x")
    axes.set_ylabel("y")
    axes.set_zlabel("z")

    axes.grid(True) # grid lines on

    x,y,z = zip(*scanner_locations.values())    # scanner locations
    axes.scatter3D(x, y, z, marker="o", color='r', s=40, label="Sensor")
    offset=50
    for x, y, z, scanner in zip(x, y, z, scanner_locations.keys()): # add scanner numbers
        axes.text3D(x+offset, y+offset, z+offset, s=scanner, color="red", fontweight="bold")

    x,y,z = zip(*beacon_locations)
    axes.scatter3D(x, y, z, marker=".", c='blue', label="Probe", s=10)

    x_line = [min(x), max(x)]
    y_line = [0, 0]
    z_line = [0, 0]
    plt.plot(x_line, y_line, z_line, color="black", linewidth=1)

    x_line = [0, 0]
    y_line = [min(y), max(y)]
    z_line = [0, 0]
    plt.plot(x_line, y_line, z_line, color="black", linewidth=1)

    x_line = [0, 0]
    y_line = [0, 0]
    z_line = [min(z), max(z)]
    plt.plot(x_line, y_line, z_line, color="black", linewidth=1)

    axes.legend()
    plt.title("Scanner and Beacon Locations", fontweight="bold")

    if outputfile:
        dir_path = Path(outputfile).parent
        if not Path.exists(dir_path):
            Path.mkdir(dir_path)
        plt.savefig(outputfile)
        logger.info("Plot saved to %s", outputfile)
    else:
        plt.show()

Plotting a 2D grid from NumPy, with Legend
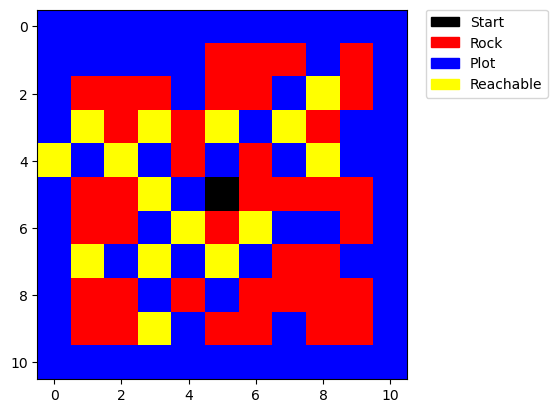
Sometimes it can be more effective to convert a 2D array into NumPy format before plotting. E.g.
Taken from 2023 Day 21: Finding Paths:
def plot(grid, start, visited: set):
    # Map the characters to numbers: S -> 0, # -> 1, . -> 2, O -> 3
    char_to_num = {'S': 0, '#': 1, '.': 2, 'O': 3}
    cmap = mcolors.ListedColormap(['black', 'red', 'blue', 'yellow'])
    numeric_grid = [[char_to_num[char] for char in row] for row in grid]

    # Convert to a NumPy array for better handling by Matplotlib
    numeric_grid = np.array(numeric_grid)

    for (ci,ri) in visited: # update visited
        numeric_grid[ri][ci] = 3
    numeric_grid[start[1],start[0]] = 0 # update start

    # Create custom patches for the legend
    labels = ['Start', 'Rock', 'Plot', 'Reachable']
    colors = ['black', 'red', 'blue', 'yellow']
    patches = [mpatches.Patch(color=colors[i], label=labels[i]) for i in range(len(colors))]

    plt.imshow(numeric_grid, cmap=cmap)
    plt.legend(handles=patches, bbox_to_anchor=(1.05, 1), loc=2, borderaxespad=0.)
    plt.show()
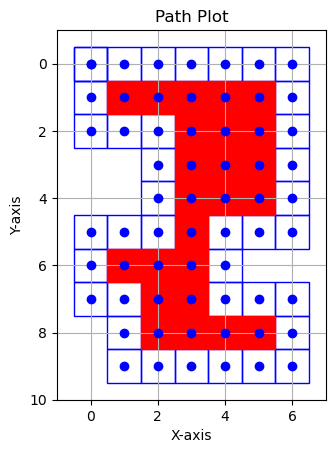
Plotting and Filling a Polygon
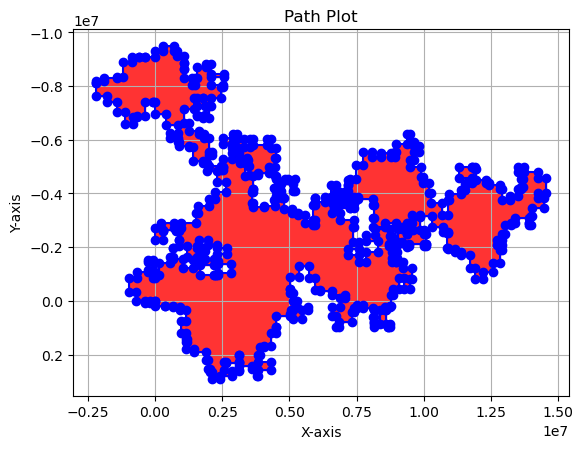
Taken from 2023 Day 18: Filling the Lava Lagoon:
def plot_path(perimeter: list[tuple[int, int]]) -> None:
    # Extract x and y values from the perimeter
    perimeter_x_values = [point[0] for point in perimeter]
    perimeter_y_values = [point[1] for point in perimeter]

    # Plot the perimeter as a line
    plt.plot(perimeter_x_values, perimeter_y_values,
             marker=MarkerStyle('o'), linestyle='-', color="blue", label="Perimeter")

    # Fill the inside of the perimeter
    plt.fill(perimeter_x_values, perimeter_y_values, color="red", alpha=0.8)  # Adjust alpha for transparency

    plt.title('Path Plot')
    plt.xlabel('X-axis')
    plt.ylabel('Y-axis')
    plt.gca().invert_yaxis()  # Invert the y-axis
    plt.gca().set_aspect('equal', adjustable='box')  # Set equal scale
    plt.grid(True)
    plt.show()
Plotting a Perimeter and Marking Contained Points
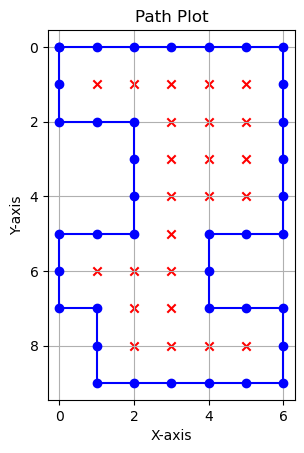
Taken from 2023 Day 18: Filling the Lava Lagoon:
def plot_path(path: list[tuple[int, int]], inside: set[tuple[int, int]] | None = None) -> None:
    inside = inside or set()
    # Extract x and y values from the path
    loop_x_values = [point[0] for point in path]
    loop_y_values = [point[1] for point in path]

    # Extract x and y values from the inside set
    inside_x_values = [point[0] for point in inside]
    inside_y_values = [point[1] for point in inside]

    # Plot the line and scatter graphs
    plt.plot(loop_x_values, loop_y_values,
             marker=MarkerStyle('o'), linestyle='-', color="blue", label="Loop")

    plt.scatter(inside_x_values, inside_y_values,
                marker=MarkerStyle('x'), color="red", label="Inside")

    plt.title('Path Plot')
    plt.xlabel('X-axis')
    plt.ylabel('Y-axis')
    plt.gca().invert_yaxis()  # Invert the y-axis
    plt.gca().set_aspect('equal', adjustable='box') # set equal scale
    plt.grid(True)
    plt.show()
Creating Squares Around Points
Taken from 2023 Day 18: Filling the Lava Lagoon:
def plot_path(path: list[tuple[int, int]], inside: set[tuple[int, int]] | None = None) -> None:
    inside = inside or set()
    fig, ax = plt.subplots()

    # Function to add a 1x1 square with the point at its centre
    def add_square(x: int, y: int, colour: str, fill: bool = False) -> None:
        square = Rectangle((x - 0.5, y - 0.5), 1, 1, fill=fill, edgecolor=colour, facecolor=colour)
        ax.add_patch(square)

    # Plot each point in the path as a square
    for point in path:
        add_square(point[0], point[1], 'blue')

    # Plot each point in the inside set as a square
    for point in inside:
        add_square(point[0], point[1], 'red', fill=True)

    # Extract x and y values for vertices
    path_x_values = [point[0] for point in path]
    path_y_values = [point[1] for point in path]
    inside_x_values = [point[0] for point in inside]
    inside_y_values = [point[1] for point in inside]

    # Plot the actual vertex points
    ax.scatter(path_x_values, path_y_values, color="blue", zorder=5)
    ax.scatter(inside_x_values, inside_y_values, color="blue", zorder=5)

    # Set limits for x and y axis
    all_x_values = [point[0] for point in path] + [point[0] for point in inside]
    all_y_values = [point[1] for point in path] + [point[1] for point in inside]

    ax.set_xlim(min(all_x_values) - 1, max(all_x_values) + 1)
    ax.set_ylim(min(all_y_values) - 1, max(all_y_values) + 1)

    plt.title('Path Plot')
    plt.xlabel('X-axis')
    plt.ylabel('Y-axis')
    plt.gca().invert_yaxis()
    plt.gca().set_aspect('equal', adjustable='box')
    plt.grid(True)
    plt.show()
Animating with Matplotlib
E.g.
Taken from 2024 Day 6: Guard Gallivant:
My VisGuardMap extends GuardMap. It animates the path of a guard moving through a grid.
create_animation()sets up the animation using matplotlib’sFuncAnimation.- It initialises a plot showing obstacles and creates empty scatter plots for each movement direction.
- The key is
animate_step, called for each frame. It iterates through the_visitedlist, which stores visited grid points and their associated directions up to the current frame (n). - For each direction, it updates the corresponding scatter plot with the coordinates of newly visited points.
- FuncAnimation then compiles these frames into an animation, saved as a video file.
This approach is efficient since we don’t recreate the axes with each frame.
class VisGuardMap(GuardMap):
    def __init__(self, grid_array: list[list[str]], animating: bool = True, **kwargs: object) -> None:
        super().__init__(grid_array=grid_array, **kwargs)

        self.animating = animating
        if self.animating:
            self._plot_info = self._setup_fig()
            self._frame_index = 0

    def _setup_fig(self) -> tuple[object, object, float, dict[str, object]]:
        """ Initialise the plot """
        my_dpi = 120
        fig, axes = plt.subplots(figsize=(1024/my_dpi, 768/my_dpi), dpi=my_dpi, facecolor="white") # set size in pixels

        axes.get_xaxis().set_visible(True)
        axes.get_yaxis().set_visible(True)
        axes.tick_params(axis='both', colors='black')  # Change tick colour
        axes.xaxis.label.set_color('black')  # Change x-axis label colour
        axes.yaxis.label.set_color('black')  # Change y-axis label colour
        axes.invert_yaxis()

        axes.set_aspect('equal') # set x and y to equal aspect
        axes.set_facecolor('xkcd:black')

        min_x, max_x = -0.5, self._width - 0.5
        min_y, max_y = -0.5, self._height - 0.5
        axes.set_xlim(min_x, max_x)
        axes.set_ylim(max_y, min_y)

        # dynamically compute the marker size
        fig.canvas.draw()
        mkr_size = ((axes.get_window_extent().width / (max_x-min_x) * (45/fig.dpi)) ** 2)

        # Plot the obstacles
        obst_x, obst_y = zip(*[(point.x, point.y) for point in self._all_obstacles])
        axes.scatter(obst_x, obst_y, marker="*", s=mkr_size*0.5, color="xkcd:azure", label="Obstacle")

        # Prepare empty scatter plots - one for each direction
        visited_scatters = {dirn: axes.scatter([], [], marker=dirn, s=mkr_size * 0.5, color="white", label=f"Visited {dirn}")
                            for dirn in VisGuardMap.DIRECTIONS}

        return fig, axes, mkr_size, visited_scatters

    def create_animation(self, output_folder: Path, file_name: str, fps=10):
        """ Create the animation, by calling the animate_step() method for each frame. """
        self._plot_info = self._setup_fig()  # Set up the figure for plotting
        fig, axes, mkr_size, visited_scatter = self._plot_info

        # Creating the animation
        logger.debug(f"Creating the animation. We have {len(self._visited_map)} frames to render.")
        anim = FuncAnimation(fig,
                             self.animate_step,
                             frames=len(self._visited),
                             interval=1000/fps, blit=True)

        # Save the animation
        output_folder.mkdir(exist_ok=True)
        output_path = Path(locations.output_dir, file_name)
        anim.save(output_path, writer='ffmpeg')

        # Close the figure to prevent inline display in Jupyter Notebook
        plt.close(fig)

    def animate_step(self, n):
        """ Add a frame for the nth step in the animation. """

        if n > 0:
            if n % 100 == 0:
                logger.debug(f"Rendering frame {n}...")

        # Update each scatter plot with points of the corresponding direction
        for dirn in VisGuardMap.DIRECTIONS:
            # Add the points to be shown in this frame, for this direction
            new_points = [(point.x, point.y) for point, d in self._visited[:n+1] if d == dirn]
            if new_points:
                x, y = zip(*new_points)
                # update the positions of the points in the scatter plot
                self._plot_info[3][dirn].set_offsets(list(zip(x, y)))

        return [scatter for scatter in self._plot_info[3].values()]
And we can use it like this:
# Implementing
guard_map = VisGuardMap(data)
while guard_map.move():
    pass

guard_map.create_animation(output_folder=locations.output_dir,
                            file_name=name,
                            fps=fps)
Going Beyond Matplotlib
Sometimes, Matplotlib isn’t the right tool for the job. Maybe you want that retro hacker aesthetic, or maybe you just need a simple GIF to share on Discord.
Console Visualisation with Rich
For 2025 Day 5: Cafeteria, the challenge involved managing inventory ranges for fresh ingredients. The “falling interval” mechanic was perfect for a console animation. Enter: Rich.
By using rich.live.Live and a Layout, we can create a smooth terminal animation. The key trick here was implementing a “Zoom Out” camera — as the coordinate ranges grew massive, we dynamically scaled the viewport to keep everything in frame.
(Groovy, right?)
    def check_zoom(self, next_interval_end: int):
        """Checks if we need to zoom out to fit the next interval."""
        screen_end = self.to_screen_x(next_interval_end)

        # If the new interval would fall off the screen
        if screen_end >= self.view_width:
            # ONE STEP ZOOM ONLY - Allows animation of the zoom process
            self.current_scale *= 5.0
            return True # Zoom happened
        return False

Generating GIFs with Pillow
For 2025 Day 4: Printing Department, we needed to help elves optimise forklift access to paper rolls on a grid. Matplotlib is great for the static frame, but for the animation, we can just save each frame as an image and stitch them together using Pillow.
This is often more robust than FuncAnimation if you want per-frame control.
    # Save the plot as a frame; store the frame in-memory, using a BytesIO buffer
    frame = BytesIO()
    plt.savefig(frame, format='png') # save to memory
    self._animator.add_frame(frame)
Complex Animations
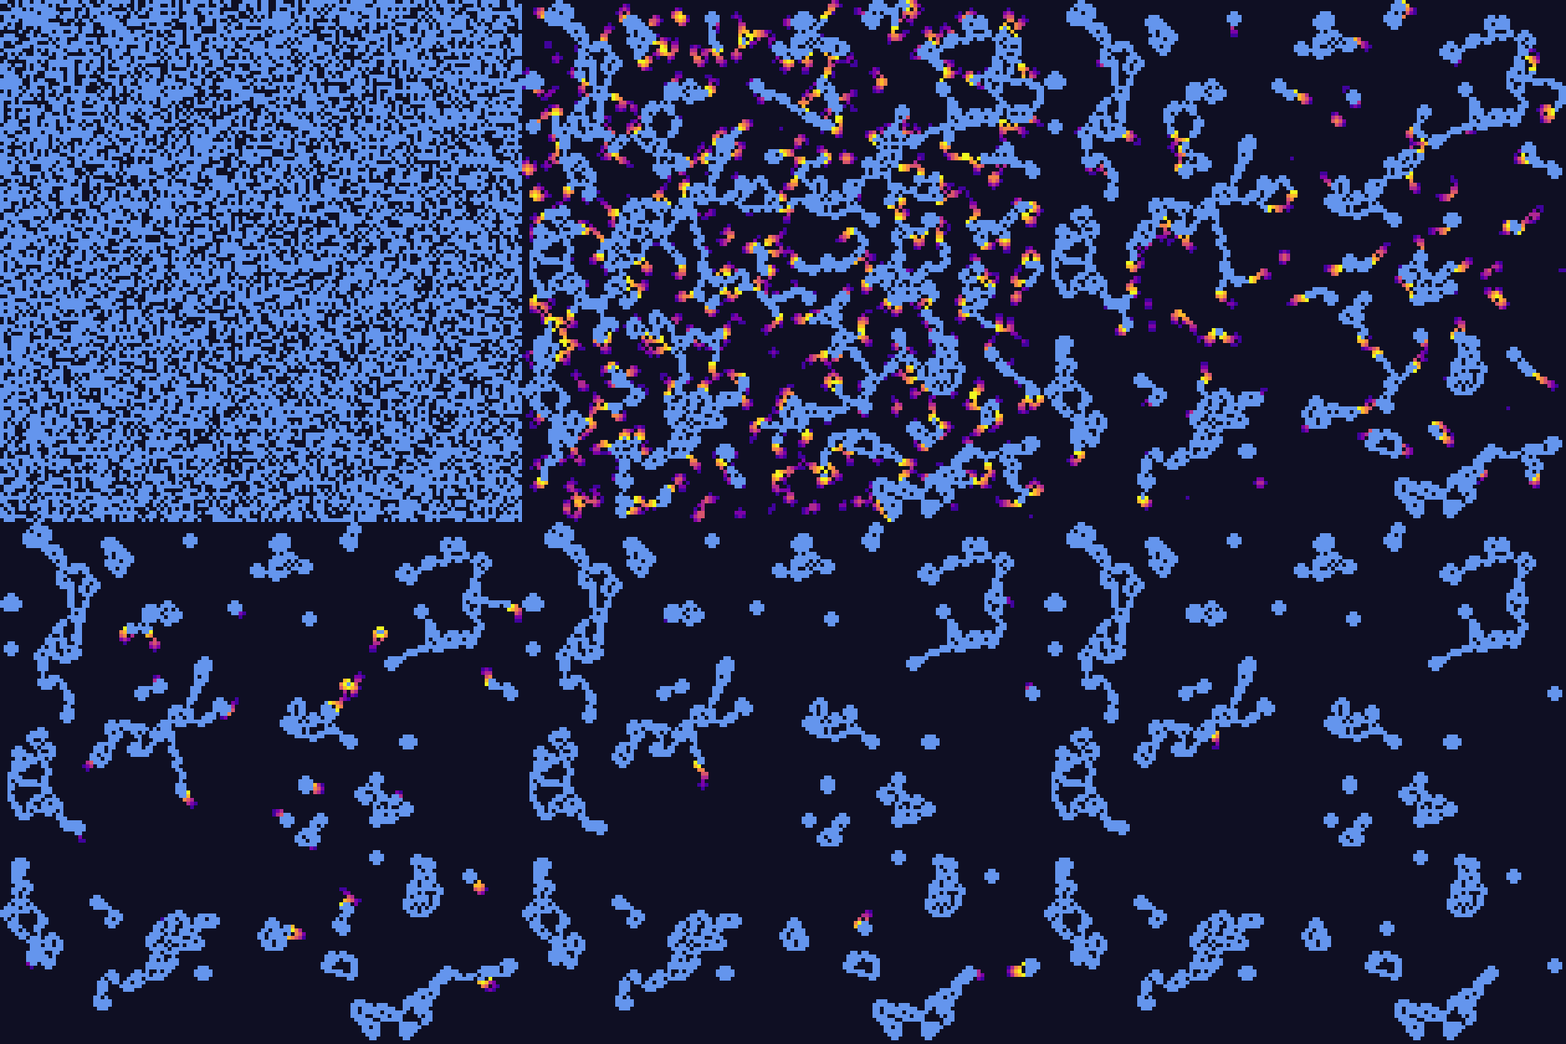
For 2025 Day 8: Playground, we found ourselves in a massive underground playground connecting lighting circuits between junction boxes in 3D space. We used FuncAnimation to visualise the clusters of connected boxes forming circuits.
Seaborn
Seaborn is a statistical data visualisation library built on top of Matplotlib. It provides high-level abstractions, attractive default themes, and built-in support for Pandas DataFrames — ideal for heatmaps, statistical distributions, and categorical plots.