Learning Python with Advent of Code Walkthroughs
Dazbo's Advent of Code solutions, written in Python
The Python Journey - Working with Images and Animations
Useful Links
Page Contents
- Overview
- Working with Different Imaging Libraries
- Loading and Showing Image File with Pillow
- Loading and Showing Image File with Matplotlib (NumPy)
- Converting from Pillow to NumPy
- Converting from NumPy to Pillow
- Converting from Matplotlib to BytesIO
- Converting from BytesIO to Pillow
- From Pillow to various formats, including BytesIO
- From BytesIO to Pillow
- From BytesIO to Matplotlib
- From BytesIO to ImageIO
- From ImageIO to File, and File to Pillow
- Examples
Overview
Images can be described as a two dimensional grid of pixels, where each pixel has a particular colour. For grayscale images, the pixels simply require intensity. Consequently, a grayscale image can be represented as a two dimensional ndarray, with shape (x, y). Whereas a colour image is typically represented as a two dimensional grid of pixels, plus three channels for each of R, G, B. Consequently, an RGB image can be represented as an ndarray with shape (x, y, 3).
There are a few ways to work with images in Python. These include:
- NumPy / Matplotlib
- Images are represented as ndarray objects: [x-size, y-size, colour channels]
- When Matplotlib is working with images, the underlying format is the NumPy ndarray.
- Pillow
- Extensive image format support and general image processing.
- Capabilities include image processing, thumbnail creation, conversion between formats, point operations, animations, and image transformation.
- ImageIO
- Useful package for reading and writing images.
- Particularly useful for animations, and for capturing images from various sources and streams.
Working with Different Imaging Libraries
The code below demonstrates how to read and write images with a few Python libraries, and how to convert between them.
First, some basic imports and prep…
from os import path, mkdir
from io import BytesIO
import imageio as iio
from PIL import Image
from matplotlib import pyplot as plt, image as plt_img
import numpy as np

SCRIPT_DIR = path.abspath(path.curdir)
print(SCRIPT_DIR)
OUTPUT_DIR = path.join(SCRIPT_DIR, "output")
IMG_FILE = path.join(SCRIPT_DIR, "my_pic.jpg")

if not path.exists(OUTPUT_DIR):
    mkdir(OUTPUT_DIR)
Loading and Showing Image File with Pillow
print("Loading image with PIL...")
pil_image = Image.open(IMG_FILE)
print(f"Type: {type(pil_image)}")
print(f"Size: {pil_image.size}")
print(f"Format: {pil_image.format}")
print(f"Mode: {pil_image.mode}")
pil_image.show("Pillow Image")  # show the image
Loading image with PIL...
Type: <class 'PIL.JpegImagePlugin.JpegImageFile'>
Size: (400, 225)
Format: JPEG
Mode: RGB
Loading and Showing Image File with Matplotlib (NumPy)
print("\nLoading image with matplotlib...")
py_img = plt_img.imread(IMG_FILE)
print(f"Type: {type(py_img)}")
print(f"Dtype: {py_img.dtype}")
print(f"Shape: {py_img.shape}")
plt.axis("off")
plt.imshow(py_img)  # attach the image to the plot
plt.show()  # show the image
Loading image with matplotlib...
Type: <class 'numpy.ndarray'>
Dtype: uint8
Shape: (225, 400, 3)
Converting from Pillow to NumPy
print("\nConverting from Pillow to NumPy ndarray...")
from_pillow_to_numpy = np.array(pil_image)
print(f"Type: {type(from_pillow_to_numpy)}")
print(f"Dtype: {from_pillow_to_numpy.dtype}")
print(f"Shape: {from_pillow_to_numpy.shape}")
plt.axis("off")
plt.imshow(from_pillow_to_numpy)
plt.show()
Converting from Pillow to NumPy ndarray...
Type: <class 'numpy.ndarray'>
Dtype: uint8
Shape: (225, 400, 3)
Converting from NumPy to Pillow
print("\nConverting from NumPy ndarray to Pillow...")
from_numpy_to_pillow = Image.fromarray(py_img)
print(f"Type: {type(from_numpy_to_pillow)}")
print(f"Size: {from_numpy_to_pillow.size}")
print(f"Format: {from_numpy_to_pillow.format}")
print(f"Mode: {from_numpy_to_pillow.mode}")
from_numpy_to_pillow.show("From NumPy to Pillow")
Converting from NumPy ndarray to Pillow...
Type: <class 'PIL.Image.Image'>
Size: (400, 225)
Format: None
Mode: RGB
Converting from Matplotlib to BytesIO
print(f"Source type: {type(py_img)}")
frame = BytesIO()
plt.imshow(py_img)  # load the image into Plt
plt.savefig(frame, format='png')  # save the image to (BytesIO) memory
plt.savefig(Path(OUTPUT_DIR, "pyplot_img_file.png"))  # save to disk
Converting from BytesIO to Pillow
print("\nReading BytesIO in Pillow...")
pil_img = Image.open(frame) # Pillow open seeks for us
pil_img.show()
From Pillow to Various Formats, Including BytesIO
print("\nOpening image in Pillow and then saving in various formats to")
print(path.abspath(OUTPUT_DIR))
pil_img = Image.open(IMG_FILE)
pil_img.save(Path(OUTPUT_DIR, "pil_img_file.jpg"))
pil_img.save(Path(OUTPUT_DIR, "pil_img_file.png"))
print("And saving directly to BytesIO...")
frame = BytesIO()
pil_img.save(frame, format="PNG") # We can save to a file, or to a file-like object, like BytesIO
print("Success.")
From BytesIO to Pillow
print("\nOpening newly saved BytesIO in Pillow...")
pil_img = Image.open(frame) # Pillow open seeks for us
pil_img.show()
From BytesIO to Matplotlib
print("And reading the BytesIO back in using Pillow, and convert to Matplotlib...")
pil_img = Image.open(frame) # Pillow open seeks for us
plt_img = np.asarray(pil_image)
plt.imshow(plt_img)
plt.show()
From BytesIO to ImageIO
# From BytesIO into ImageIO
print("From BytesIO back into ImageIO...")
frame.seek(0)   # We need to seek back to 0
iio_img = iio.imread(frame)
From ImageIO to File, and File to Pillow
# And saving ImageIO to file
print("From ImageIO to file...")
iio.imsave(Path(OUTPUT_DIR, "iio_file.png"), iio_img)

# Let's read it back, to prove...
print("And from file to Pillow to show...")
pil_img = Image.open(Path(OUTPUT_DIR, "iio_file.png")) # Pillow open seeks for us
pil_img.show()
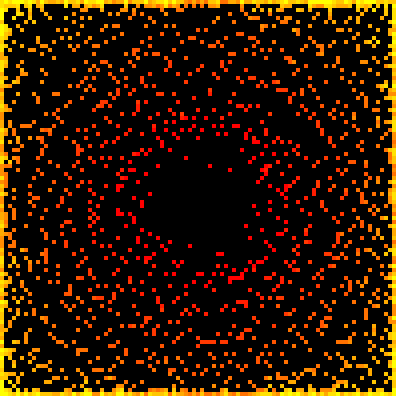
Examples
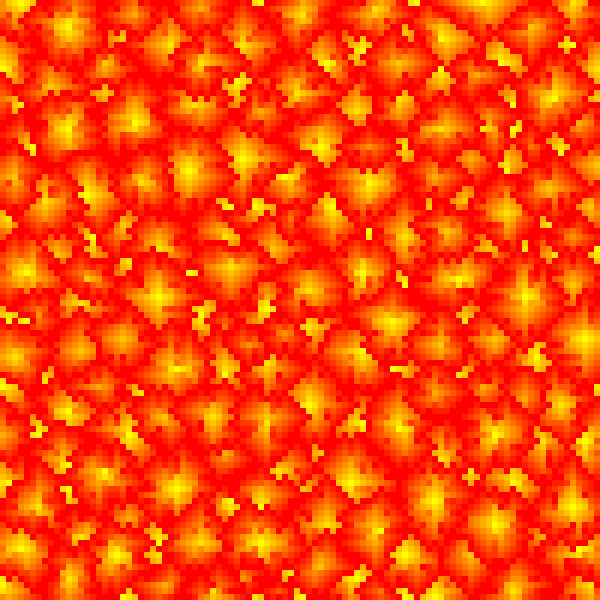
Heatmap
From 2021 Day 9 - Lava Basins:
    def render_image(self, target_width:int=600) -> Image.Image:
        """ Render grid as a heatmap image

        Args:
            width (int, optional): Target width, in pxiels. Defaults to 600.
        """
        scale = target_width // self._width  # our original image is only a few pixels across. We need to scale up.

        # Flatten our x,y array into a single list of height values
        height_values = [self.height_at_point(Point(x,y)) for y in range(self._height)
                                                          for x in range(self._width)]
        max_height = max(height_values)

        # create a new list of RGB values, where each is given by an (R,G,B) tuple.
        # To achieve a yellow->amber->red effect, we want R to always be 255, B to always be 0, and G to vary based on height
        pixel_colour_map = list(map(lambda x: (255, int(255*((max_height-x)/max_height)), 0), height_values))

        image = Image.new(mode='RGB', size=(self._width, self._height))
        image.putdata(pixel_colour_map)  # load our colour map into the image

        # scale the image and return it
        return image.resize((self._width*scale, self._height*scale), Image.NEAREST)
Flashing Grid
Taken from 2021 Day 11 - Flashing Octopi:
    def generate_frame(self):
        """ Render an image frame showing the current cycle state.
        Saves the frame to the self._frames list.
        Superimposes the cycle number text to the frame. """
        scale = 50
        all_values = [self.value_at_point(point) for point in self.all_points()] # flattened values
        max_energy = Grid.FLASH_THRESHOLD

        # create a new list of pixels, where each is given by an (R,G,B) tuple.
        pixel_colour_map = list(map(lambda x: (x*255//max_energy, 0, 0), all_values))

        # Create an image from the flattened list of pixels, and scale up the size
        small_image = Image.new(mode='RGB', size=(self.x_size, self.y_size))
        small_image.putdata(pixel_colour_map)  # load our original data into the image
        scaled_image = small_image.resize((self.x_size * scale, self.y_size * scale))

        # Add our cycle count text to the bottom right of the image
        image_draw = ImageDraw.Draw(scaled_image)
        font = ImageFont.truetype('arial.ttf', 24)
        text = str(self._generation)
        rgba = (140, 200, 250, 255) # light blue
        textwidth, textheight = image_draw.textsize(text, font)
        im_width, im_height = scaled_image.size
        margin = 10     # margin we want round the text to the edge
        x_locn = im_width - textwidth - margin
        y_locn = im_height - textheight - margin
        image_draw.text((x_locn, y_locn), text, font=font, fill=rgba)

        if (0, 0, 0) in pixel_colour_map:  # if 0 in colour_map, we need to flash
            flash_image = small_image.copy()
            new_image_data = []
            for pixel in pixel_colour_map:
                if pixel == (0, 0, 0):  # replace black with white
                    new_image_data.append((255, 255, 255))
                else:
                    new_image_data.append(pixel)

            # Add the new image data, and then resize as before
            flash_image.putdata(new_image_data)
            flash_image = flash_image.resize((self.x_size * scale, self.y_size * scale))

            flash_image_draw = ImageDraw.Draw(flash_image)
            flash_image_draw.text((x_locn, y_locn), text, font=font, fill=rgba)

            # Flash frame needs to get appended before the 'black' frame
            self._frames.append(flash_image)

        self._frames.append(scaled_image)
Trench Map
Taken from 2021 Day 20 - Trench Map Enhancement:
    def _render_image(self) -> Image.Image:
        """ Render as an image """
        width = (self._max_x+1) - self._min_x
        height = (self._max_y+1) - self._min_y

        image = Image.new(mode='RGB', size=(width, height))
        image_data = []

        for y in range(width):
            for x in range(height):
                x_val = x + self._min_x
                y_val = y + self._min_y
                point = Point(x_val, y_val)

                if point in self._pixels:
                    image_data.append((255, 255, 255)) # lit pixels
                else:
                    image_data.append((128, 0, 0)) # dark pixels

        image.putdata(image_data)
        return image
Height Map
Taken from 2022 Day 8 - Tree House Grid:
    def render_image(self, target_width:int=600) -> Image.Image:
        """ Render grid as a heatmap image

        Args:
            width (int, optional): Target width, in pxiels. Defaults to 600.
        """
        scale = target_width // self._width  # our original image is only a few pixels across. We need to scale up.

        hidden_trees = self.get_hidden_trees()

        # Flatten our x,y array into a single list of height values
        # If the tree is a hidden tree, set its height to -1 in the flattened array
        height_values = [self.height_at_point(Point(x,y))
                         if Point(x,y) not in hidden_trees else -1
                                        for y in range(self._height)
                                        for x in range(self._width)]

        max_height = max(height_values)

        # create a new list of RGB values, where each is given by an (R,G,B) tuple.
        # To achieve a yellow->amber->red effect, we want R to always be 255, B to always be 0, and G to vary based on height
        pixel_colour_map = list(map(
                    lambda x: (255, int(255*((max_height-x)/max_height)), 0) if x >= 0 else (0, 0, 0),
                    height_values))

        image = Image.new(mode='RGB', size=(self._width, self._height))
        image.putdata(pixel_colour_map)  # load our colour map into the image

        # scale the image and return it
        return image.resize((self._width*scale, self._height*scale), Image.Resampling.NEAREST)
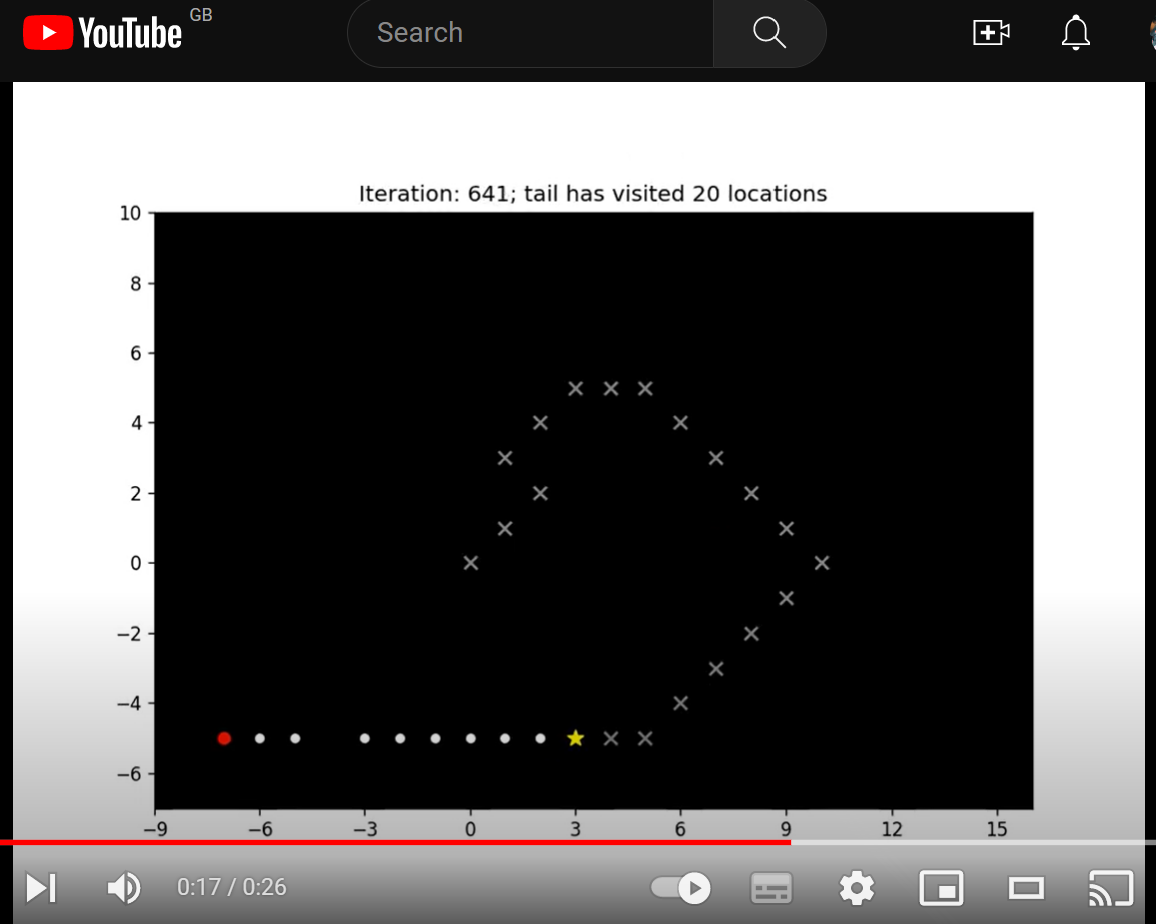
Roap Bridge
Taken from 2022 Day 9 - Road Bridge.
Here we use matplotlib and imageio to render an animation:
    def _init_plt(self):
        """ Generate a Figure and Axes objects which are reused. """
        my_dpi = 120
        figure, axes = plt.subplots(figsize=(1024/my_dpi, 768/my_dpi), dpi=my_dpi, facecolor="white") # set size in pixels
        axes.set_aspect('equal') # set x and y to equal aspect
        axes.set_facecolor('xkcd:black')

        return figure, axes

    def _render_frame(self, visited: set[Point], iteration: int=0):
        """ Only renders an animation frame if we've attached an enabled Animator """

        fig, axes = self._plt_info
        axes.clear()

        # The grid will grow as the rope heads moves around
        max_x = max(self._all_head_locations, key=lambda point: point.x).x
        min_x = min(self._all_head_locations, key=lambda point: point.x).x
        max_y = max(self._all_head_locations, key=lambda point: point.y).y
        min_y = min(self._all_head_locations, key=lambda point: point.y).y
        axes.set_xlim(min_x - 2, max_x + 2)
        axes.set_ylim(min_y - 2, max_y + 2)

        # dynamically compute the marker size
        fig.canvas.draw()
        factor = 40  # Smaller factor means smaller markers
        mkr_size = int((axes.get_window_extent().width / (max_x-min_x+1) * (factor/fig.dpi)) ** 2)

        # make sure the ticks have integer values
        axes.xaxis.set_major_locator(MaxNLocator(integer=True))

        head = self._knots[0]
        tail = self._knots[-1]
        others_knots = self._knots[1:-1]

        visited_x = [point.x for point in visited if point != tail]
        visited_y = [point.y for point in visited if point != tail]

        for knot in others_knots:
            axes.scatter(knot.x, knot.y, marker=MarkerStyle("."), s=mkr_size/2, color="white")

        axes.scatter(head.x, head.y, marker=MarkerStyle("."), s=mkr_size, color="red")
        axes.scatter(visited_x, visited_y, marker=MarkerStyle("x"), s=mkr_size/3, color="grey")
        axes.scatter(tail.x, tail.y, marker=MarkerStyle("*"), s=mkr_size/2, color="yellow")

        axes.set_title(f"Iteration: {iteration}; tail has visited {len(visited)} locations")

        # save the plot as a frame; store the frame in-memory, using a BytesIO buffer
        frame = BytesIO()
        plt.savefig(frame, format='png') # save to memory, rather than file
        self._animator.add_frame(frame)