Learning Python with Advent of Code Walkthroughs
Dazbo's Advent of Code solutions, written in Python
The Python Journey - Zip

Useful Links
Page Contents
- Overview
- Iterating Over Two Iterables at Once
- Transposing Rows and Columns
- Unpacking An Arbitrary Number of Iterables
- Turning (x,y) coordinates into a List of x and a List of y
- Making a Mapping Dictionary
- Examples
Overview
The zip() function is very cool!
In short, it combines n iterables of length x, to create a single new iterable of length n, with each element being a tuple of n items.
What does THAT mean?
It’s easier with an example…
questions = ['Your name?', 'Your quest?', 'Your favourite color?']
answers = ['Lancelot', 'The Holy Grail', 'Blue. No... Red!']

# print the tuple
for item in zip(questions, answers):
    print(item)
The output:
('Your name?', 'Lancelot')
('Your quest?', 'The Holy Grail')
('Your favourite color?', 'Blue. No... Red!')
So here, we started with 2 lists that both had 3 elements. By zipping them together, we ended up with one list made up of tuples, with each tuple being made up of 2 elements.
Iterating Over Two Iterables at Once
We can even do this:
questions = ['name', 'quest', 'favourite color']
answers = ['I am Arthur, King of the Britons', 'We seek the Holy Grail', 'Blue!']

# unpack and format the tuple
for q, a in zip(questions, answers):
    print(f'What is your {q}?  {a}')
Output:
What is your name?  I am Arthur, King of the Britons
What is your quest?  We seek the Holy Grail
What is your favourite color?  Blue!
Transposing Rows and Columns
Imagine we have four different lists:
- One list containing all the days of the week.
- Three more lists, where each list contains a percentage change for a coin value on that day of the week.
We can think of this as four rows and seven columns. Using zip(), we can turn this into seven rows of four columns:
# daily % changes for these coins, over 6 days
day = ['Monday', 'Tuesday', 'Wednesday', 'Thursday', 'Friday', 'Saturday', 'Sunday']
btc = [3.4, 1.5, 5.2, -2, -3, 7.1, 8.0]
eth = [0.4, 0.2, 7.0, 2.5, 1.5, 8.0, 10.0]
doge = [-12.8, -30.0, -10.0, 0.0, 30.2, 11.1, 15.0]

for item in zip(day, btc, doge, eth):
    print(item)
Output:
('Monday', 3.4, -12.8, 0.4)
('Tuesday', 1.5, -30.0, 0.2)
('Wednesday', 5.2, -10.0, 7.0)
('Thursday', -2, 0.0, 2.5)
('Friday', -3, 30.2, 1.5)
('Saturday', 7.1, 11.1, 8.0)
('Sunday', 8.0, 15.0, 10.0)
Unpacking An Arbitrary Number of Iterables
We can use the splat operator to zip any arbitrary number of iterables. For example, we could re-write the example above like this:
# daily % changes for these coins, over 6 days
day = ['Monday', 'Tuesday', 'Wednesday', 'Thursday', 'Friday', 'Saturday', 'Sunday']
btc = [3.4, 1.5, 5.2, -2, -3, 7.1, 8.0]
eth = [0.4, 0.2, 7.0, 2.5, 1.5, 8.0, 10.0]
doge = [-12.8, -30.0, -10.0, 0.0, 30.2, 11.1, 15.0]

coin_changes = [day, btc, doge, eth]    # Making a single list of lists, to demonstrate splatting
# unpack (splat) the list of lists, and then zip the resulting lists
transposed = list(zip(*coin_changes))
for row in transposed:
    print(row)
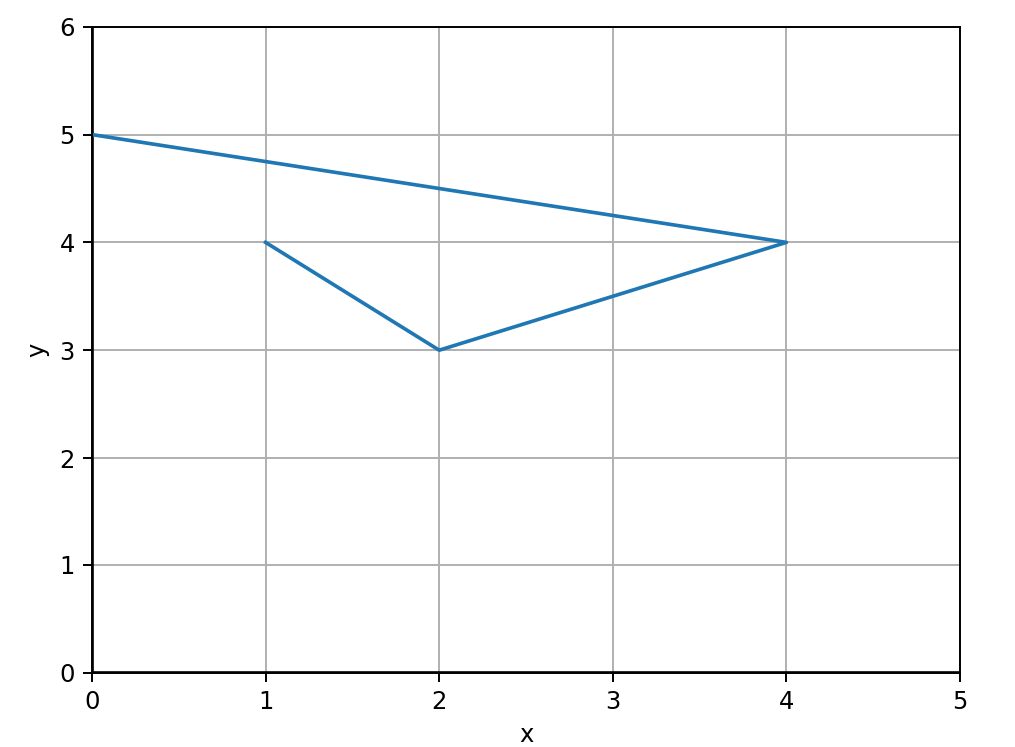
Turning (x,y) coordinates into a List of x and a List of y
Sometimes it can be really useful to extract all the x values and all the y values, from a collection of points. For example, if plotting multiple points with matplotlib.pyplot.plot(), the plot() method expects all the x values as an array, and all the y values as an array.
from matplotlib import pyplot as plt

# create list of points
points = [
    (1, 4),
    (2, 3),
    (4, 4),
    (0, 5)
]

print(points)

# Unpack our x, y vals
all_x, all_y = zip(*points)
print(f"all_x: {all_x}")
print(f"all_y: {all_y}")

# Create out axes
fig, axes = plt.subplots()

# add lines at x=0, y=0 and labels
plt.axhline(0, color='black')
plt.axvline(0, color='black')
axes.set_xlim(0, max(all_x)+1)
axes.set_ylim(0, max(all_y)+1)
axes.set_xlabel("x")
axes.set_ylabel("y")

# add grid lines
axes.grid(True)

plt.plot(all_x, all_y)
plt.show()
The output:
[(1, 4), (2, 3), (4, 4), (0, 5)]
all_x: (1, 2, 4, 0)
all_y: (4, 3, 4, 5)
And the rendered plot:
Making a Mapping Dictionary
We can use zip() to create a dictionary that maps one value to another. For example:
openers = ["(", "[", "{", "<"]
closers = [")", "]", "}", ">"]
open_to_close = dict(zip(openers, closers))

print(open_to_close)
Output:
{'(': ')', '[': ']', '{': '}', '<': '>'}
Examples
- Creating an unscramble map - 2021 day 8
- Pairing openers and closers - 2021 day 10
- Zipping points and labels for a plot - 2021 day 15
- Creating instructions from three lists - 2021 day 24
- Get columns from rows - 2022 day 8
- Transpose list of tuples to x and y lists - 2022 day 10
- Print columns as str from a 2D grid - 2022 day 22
- Transpose a collection of points into list of x and list of y - 2022 day 23