Learning Python with Advent of Code Walkthroughs
Dazbo's Advent of Code solutions, written in Python
Advent of Code 2021 - Day 17
Useful Links
Concepts and Packages Demonstrated
Regular expressionsRegexrMatplotlibmapGorillas
Problem Intro
They say HI? The stupid elves say HI? The next elf I see is getting punched in the face.
Anyhoo… Today’s challenge is a bit of a relief compared to yesterday.
We need to fire a probe into a large ocean trench. We’re firing probes from initial x,y position of 0,0, and we need the probes to pass through a target area. We’re able to adjust the initial x,y velocity of our probe. We’re told that:
xis the forward (horizontal) velocity.yis the upward (vertical) velocity. Positive means up.- For any given velocity
x,y, the probe will move a horizontal distancexand a vertical distancey, per step. I like to think of a step as a unit of time,t. xdecreases by 1 towards 0, with each step, due to drag. This means that regardless of our initial value ofx, there will come a point where our probe will cease to move horizontally.yalways decreases by 1, due to gravity. Thus, regardless of our initial value ofy,ywill always approach negative infinity.- Combining these two facts, we know that eventually, every probe will fall straight down.
Our input is a target area, and it looks like this:
target area: x=20..30, y=-10..-5
The x and y values represent ranges. Thus, the target area is a rectangle.
We could draw the rectangle like this, showing our x,y coordinates at each corner:
20, -5 xxxxxxxxxxx 30, -5
       xxxxxxxxxxx
       xxxxxxxxxxx
       xxxxxxxxxxx
       xxxxxxxxxxx
20,-10 xxxxxxxxxxx 30,-10
Crucially, we’re told that for our probe to successfully make it to the trench, it needs to hit the target area after any step. Thus, for any given time t, the probe’s location must in in the target area. It is not sufficient to determine that the probe simply passed through the target area between any time t and any time t-1.
Part 1
What is the highest y position it reaches on this trajectory?
Okay, this is simple enough. Essentially, we need to lob the probe up in an arc. We’re looking for the arc that hits the target area, and reaches the highest point. Okay, it might not be an actual arc, since our horizontal movement might stop whilst it’s still going up. I.e. it might still be going up, whilst not moving out. And that won’t look much like an arc!
Here’s the game plan:
- Establish our target area, with corners top_left, top_right, bottom_right, bottom_left.
- Create a formula to calculate velocity at step t, given an initial velocity.
- Then, loop through a range of initial velocities, with:
- x from 0 to x_right, since we can only fire right, towards the target.
- y from bottom_y to abs(bottom_y), since we can fire both down towards the target, but also up.
- Then loop infinitely through steps, and determine x,y locations at each step.
- Store max y achieved in this loop so far.
- Build a dict of {init vel: max y} for any init velocities that hit the target.
- Return the max y overall.
Setup
from dataclasses import dataclass
import logging
from pathlib import Path
import time
import re
from matplotlib import pyplot as plt

logging.basicConfig(format="%(asctime)s.%(msecs)03d:%(levelname)s:%(name)s:\t%(message)s",
                    datefmt='%Y-%m-%d %H:%M:%S')
logger = logging.getLogger(__name__)
logger.setLevel(logging.INFO)

SCRIPT_DIR = Path(__file__).parent
# INPUT_FILE = "input/input.txt"
INPUT_FILE = "input/sample_input.txt"

RENDER = True
OUTPUT_DIR = Path(SCRIPT_DIR, "output/")
OUTPUT_FILE = Path(OUTPUT_DIR, "trajectory.png")
- I’ve included
matplotlib, as I want to visually plot the trajectories. (You don’t have to, obviously!) - I’ve included
re, as I’m going to parse the input data with regular expressions.
Solution
First, some simple classes:
@dataclass(frozen=True)
class Point():
    x: int
    y: int

class Velocity(Point):
    """ A vector represented as (x, y) values """

@dataclass
class Rect():
    """ Rectangle from four corner Points, and knows whether a given point is enclosed by this rectangle """
    left_x: int
    right_x: int
    bottom_y: int
    top_y: int

    def encloses(self, point:Point) -> bool:
        return (self.left_x <= point.x <= self.right_x
                and self.bottom_y <= point.y <= self.top_y)

    def as_polygon(self) -> tuple[list, list]:
        """ Convert to set of polygon points, in the order tl, tr, br, bl,
        and returned as (list of x coords, list of y coords) """
        return ([self.left_x, self.right_x, self.right_x, self.left_x],
                [self.top_y, self.top_y, self.bottom_y, self.bottom_y])
Notes on these:
Pointis simple enough. It’s an immutable dataclass.VelocitysubclassesPoint. In fact, ourVelocityclass is identical toPoint. But I think it’s conceptually easier to be able to work with both points, and velocities. But at the end of the day, both classes simple have x and y values.Rectrepresents a rectangle, as four corner points.- The
encloses()method is what we’ll use to check whether a probe is in the target area (rectangle). - The
as_polygon()method returns our four corners as a clockwise list of all the corner x values (starting top left), and a clockwise list of all the corner y values (also starting top left). I use this when I’m rendering the rectangle in matplotlib.
- The
Now our function to determine the velocity at any time, given an initial velocity:
def velocity_at_step(init: Velocity, t: int) -> Velocity:
    """ Returns the velocity (x,y) at a given step. """
    x = abs(init.x) - t if t < init.x else 0  # shrinks towards 0
    y = init.y - t  # always decreases towards -ve infinity

    return Velocity(x, y)
Now let’s read the data.
input_file = Path(SCRIPT_DIR, INPUT_FILE)
with open(input_file, mode="rt") as f:
    data = f.read().strip()

# Note that x and y values can be -ve
match = re.search(r"x=(-?\d+)\.\.(-?\d+), y=(-?\d+)\.\.(-?\d+)", data)
assert match, "Don't expect invalid input data"
target = Rect(*map(int, match.groups()))
logger.info(target)
- We start by reading in the input as a
str. - Then we use
re.search()to match a number of groups in the `str. If you’re not too familiar with regex patterns, then this pattern works like this:- It starts by looking for a
strthat matches: “x=(number)..(number), y=(number)..(number)”. - The four individual groups are denoted by brackets.
- Each number is determined using “
-?\d+”, which means optional “-”, followed by a compulsory number, made up one or more digits. The “-?” is necessary, since our numbers could be negative. - To represent “
..” we have to escape each dot using “\.”, because the “.” character is otherwise interpreted as an any character placeholder by the regex parser. - If you want to test your regular expressions as you build them, consider using the very awesome Regexr.com.
- It starts by looking for a
- We then
assertthat a match was found, as we always expect it to be. - We then use
map()to convert each item ofgroups()to anint, and we pass the fourintvalues to ourRectconstructor. This is how we construct the rectangle target area.
And now we can test out some trajectories!
successful_peaks = {}    # init_velocity: peak
highest_trajectory = []
max_y = 0
for x in range(1, target.right_x+1):   # No point having x larger than max target distance
    for y in range(target.bottom_y, abs(target.bottom_y)):   # remember we can fire up
        init_v = Velocity(x, y)
        hit, trajectory = evaluate_trajectory(target, init_v)
        if hit:     # if this was a good trajectory to hit the target
            this_max_y = max(point.y for point in trajectory)
            successful_peaks[init_v] = this_max_y  # store the heighest point for this init_v
            if this_max_y > max_y:  # If this trajectory has given a new highest point
                highest_trajectory = trajectory
                max_y = this_max_y

logger.info("Max peak=%d", max_y)
This works as follows:
- We need to start with some reasonable bounds of initial
x,yvelocities to try. I’ve gone with trying all initialxbetween 0 and the right edge of the target area, and all initialybetween the value of the bottom of the target area, and the same value in the upwards direction. - For each initial
Velocity x,y:- Try this velocity, and see if it hits the target area. If it does, we return the successful trajectory, in the form of every point the probe crossed up until and including when it arrived in the target area.
- Store the maximum
yfor all the points in this trajectory, i.e. the highest point reached by the probe. - Store this maximum
yin a dict using a key of the initial velocity. I.e. to build up a dictionary of every peak for every successful initial velocity. - If this
ywas higher than theyof any previous trajectory, then store this trajectory as thehighest_trajectory.
We then print the highest y that was reached, in order to solve Part 1.
Finally, we just need to implement the function that actually builds a trajectory for an initial velocity, and determine if this trajectory hits the target area. This is our evaluate_trajectory() function:
def evaluate_trajectory(target: Rect, initial_v: Velocity) -> tuple[bool, list[Point]]:
    """ Given a target region to hit and an initial velocity,
    determine if we will hit the target on any step.

    Args:
        target (Rect): Region we need to hit
        initial_v (Velocity): Initial x, y velocity at t=0

    Returns:
        tuple[bool, list[Point]]: Whether trajectory hit the target, and the path taken.
    """
    t = 0
    location = Point(0,0)  # Where we launch our probe from
    trajectory: list[Point] = [location]
    hit_target = False

    while not hit_target:
        vel = velocity_at_step(initial_v, t)
        location = Point(location.x + vel.x, location.y + vel.y)
        trajectory.append(location)

        if (vel.x == 0 and location.x < target.left_x):
            break   # we're just going to fall downwards from here.

        if location.x > target.right_x or location.y < target.bottom_y:
            break   # we've overshot the target

        if target.encloses(location): # If we've hit the target
            hit_target = True
            break

        # If we're here, we haven't yet reached the target
        t += 1

    return hit_target, trajectory
This works by:
- Set initial location to
Point(0,0). - Create a
listto store allPointsin this trajectory, including the initial location. - While we haven’t hit the target:
- Determine the
Velocityat this step. - Determine the new location by adding the current
Velocityto the last locationPoint. - Add the
Pointto our trajectorylist. - If the current
Velocityis 0 in thexdirection and the current location is left of the target region, then we’ll never reach the target region, i.e. because we can’t move further right. So break. - If the current location is right of target region, or below the target region, then we’ve overshot. So break.
- If we’ve hit the target, then exit the loop.
- Determine the
- Finally, return the
tupleof whether we hit the target, and the trajectory.
Part 2
We’re asked to count how many distinct initial velocities will allow our probe to hit the target area after any step.
Good news! We’ve already done this! We previously created a dictionary that stored the peak for every successful initial velocity. So we just need to count how many successful initial velocities there were.
logger.info("Count of valid shots=%d", len(successful_peaks))
The final output looks like this:
2022-01-24 21:39:11.557:INFO:__main__:  Rect(left_x=153, right_x=199, bottom_y=-114, top_y=-75)
2022-01-24 21:39:12.239:INFO:__main__:  Max peak=6441
2022-01-24 21:39:12.239:INFO:__main__:  Count of valid shots=3186
2022-01-24 21:39:12.653:INFO:__main__:  Plot saved to c:\Users\djl\localdev\Python\Advent-of-Code\src\AoC_2021\d17_probe_trajectory_re_points\output\trajectory.png
2022-01-24 21:39:12.654:INFO:__main__:  Execution time: 0.3965 seconds
Phew! That was easy!!
Plotting the Trajectory
Just for kicks, let’s visually plot the trajectory.
if RENDER:
    plot_trajectory(highest_trajectory, target) # show the plot
else:
    plot_trajectory(highest_trajectory, target, OUTPUT_FILE) # save the plot


def plot_trajectory(trajectory: list[Point], target: Rect, outputfile=None):
    """ Render this trajectory as a plot, and optionally save it """
    axes = plt.gca()

    # Add axis lines at x=0 and y=0
    plt.axhline(0, color='green')
    plt.axvline(0, color='green')
    axes.grid(True) # grid lines on

    # Set up titles
    axes.set_title("Trajectory")
    axes.set_xlabel("Horizontal")
    axes.set_ylabel("Height")

    axes.fill(*target.as_polygon(), 'cyan')  # add the target area
    plt.annotate("TARGET", (target.left_x, target.top_y),
                 xytext=(target.left_x + ((target.right_x - target.left_x)/2)-2,
                        (target.top_y - (target.top_y-target.bottom_y)/2)-1),
                 color="blue", weight='bold')

    # Plot the trajectory points
    all_x = [point.x for point in trajectory]
    all_y = [point.y for point in trajectory]
    plt.plot(all_x, all_y, marker="o", markerfacecolor="red", markersize=4, color='black')

    x, y = trajectory[1].x, trajectory[1].y
    plt.annotate(f"Vel {x},{y}", (x,y), xytext=(x-3, y+2))  # label first point
    x, y = [(point.x, point.y) for point in trajectory if point.y == max(point.y for point in trajectory)][0]
    plt.annotate(f"({x},{y})", (x,y), xytext=(x+1, y-1))  # label highest point

    if outputfile:
        dir_path = Path(outputfile).parent
        if not Path.exists(dir_path):
            Path.mkdir(dir_path)
        plt.savefig(outputfile)
        logger.info("Plot saved to %s", outputfile)
    else:
        plt.show()
- I use
RENDERto set whether we should show the visualisation interactively, or whether to save it as a file. If we’re saving as a file, we need to pass the file as a parameter. If not, then the output file parameter defaults toNone. - We obtain the plot area using Matplotlib’s
plot.gca(). - We add axis lines that pass through the origin.
- We add some grid lines.
- We add a title and label the axes.
- We then add a filled polygon, passing in
xlist andylist, as created usingas_polygon()from ourRectobject. - We add an annotation, i.e. text, which sits within the rectangle area.
- We then use
plt.plot()to create alineplot for all points in the trajectory. - We then add further annotations, i.e. labels for the initial velocity, and for the highest point.
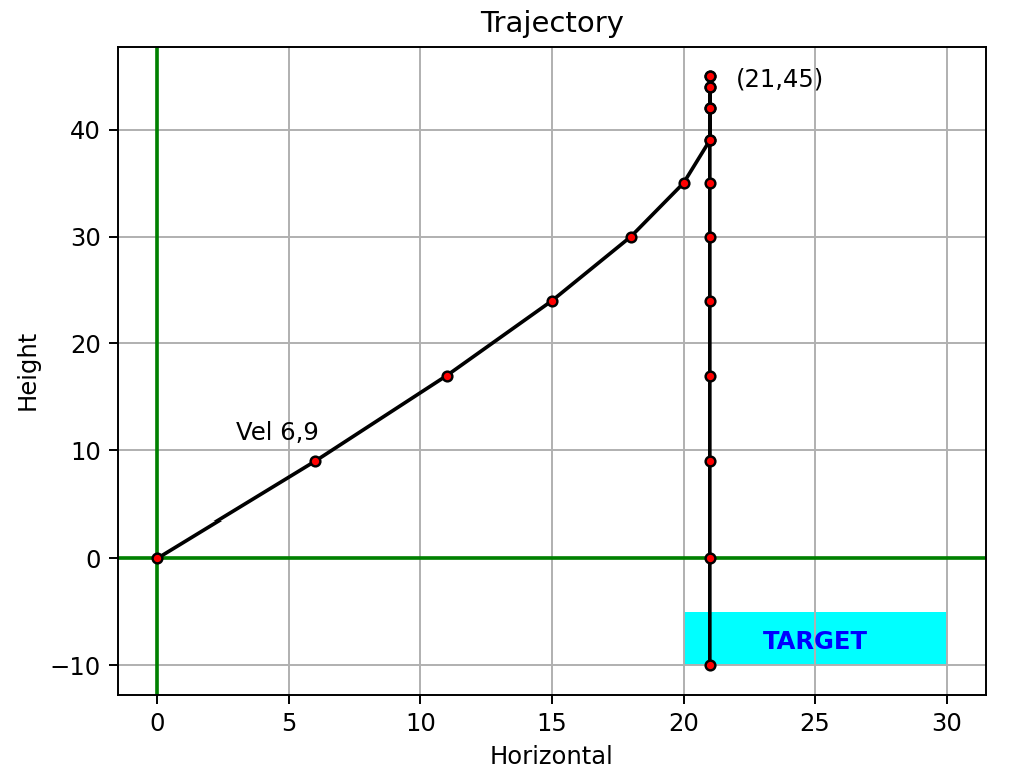
With the sample data, the output looks like this:
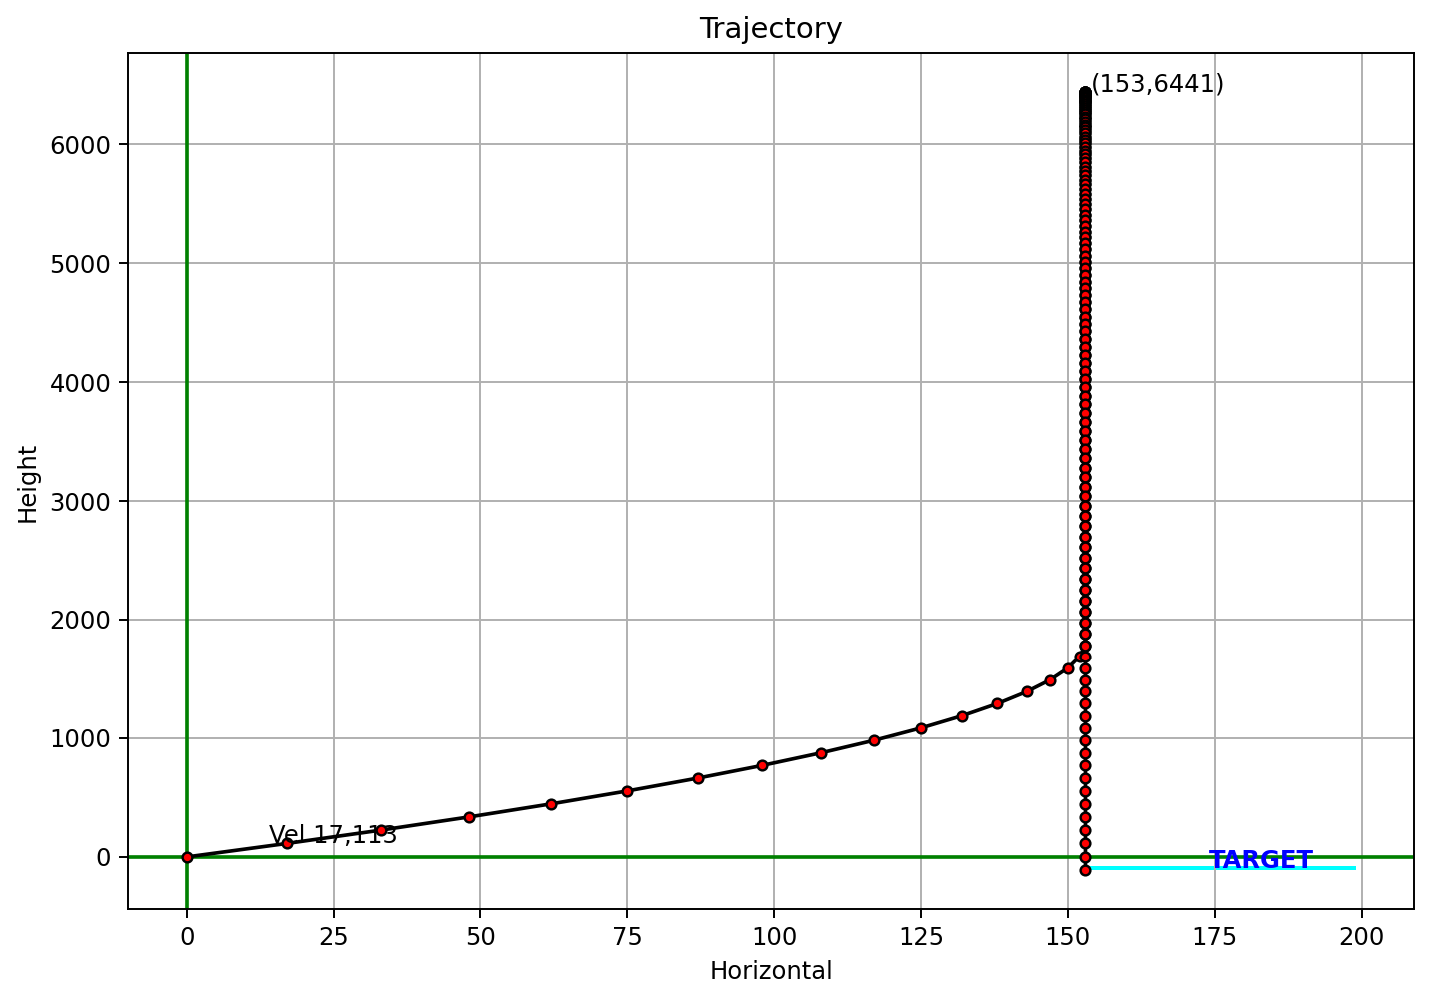
And with the actual data:
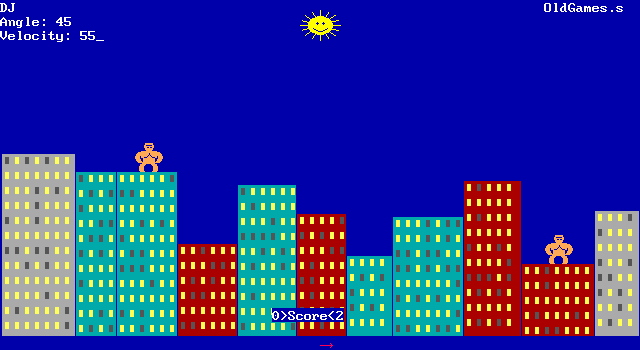
Gorillas!
Gorillas is a game two gorillas each throw bananas at each other. The goal is to hit the other gorilla with the banana. You play one of the gorillas. When you take your turn, you have to establish an angle and a velocity. So, it’s a lot like our probe trajectories!
I first played Gorillas on a 386 PC in the early 90s. Gorillas came as source code, with the QBasic language that was shipped with MSDOS.
If you want to play it, you can pop over to Classic Reload and play it on your browser!