Page Contents
- Measuring Time with time.perf_counter
- The ac.timer() Context Manager
- Automated Profiling in Template v3
- Progress Bars with tqdm
- Examples
Measuring Time with time.perf_counter
The standard library time module is the most straightforward way to measure elapsed code execution time in Python.
For benchmarking, always use time.perf_counter(). Unlike time.time(), perf_counter() is a monotonic clock with the highest available resolution on your platform, meaning it is not affected by system clock updates or daylight saving adjustments:
import time

t1 = time.perf_counter()
time.sleep(2)  # Simulate a 2-second computation
t2 = time.perf_counter()

print(f"Execution time: {t2 - t1:0.4f} seconds")
Output:
Execution time: 2.0037 seconds
We format the elapsed duration with 4 decimal places of precision using :0.4f inside a Python f-string.
Here is a shorter measurement:
import time

t1 = time.perf_counter()
time.sleep(0.01)  # Simulate waiting for 10ms
t2 = time.perf_counter()

print(f"Execution time: {t2 - t1:0.4f} seconds")
Output:
Execution time: 0.0109 seconds
The ac.timer() Context Manager
Writing manual t1 and t2 boilerplate around every function quickly clutters your solution. To keep things clean, our shared aoc_common library provides the ac.timer() context manager in src/aoc_common/aoc_commons.py:
import aoc_common.aoc_commons as ac

with ac.timer("Solving Part 1"):
    # Run intensive algorithm or search
    result = solve_part1(data)
When the with block finishes, ac.timer() calculates the elapsed time and logs it automatically through the configured logger:
INFO Solving Part 1: 0.145 seconds
Automated Profiling in Template v3
Even better: in modern Template v3 solutions, you do not need to write any timing code at all!
When you execute a puzzle with uv run aoc run <target>:
uv run aoc run 2025d01
The shared test runner (src/aoc_common/runner.py) uses perf_counter under the hood to profile:
- Input parsing duration (
parse_input). - Part 1 execution time (
part1). - Part 2 execution time (
part2).
It formats the elapsed duration dynamically with ac.format_duration (rendering microseconds, milliseconds, or seconds appropriately) and displays the results in a clean Rich summary table with colourised status markers.
Progress Bars with tqdm
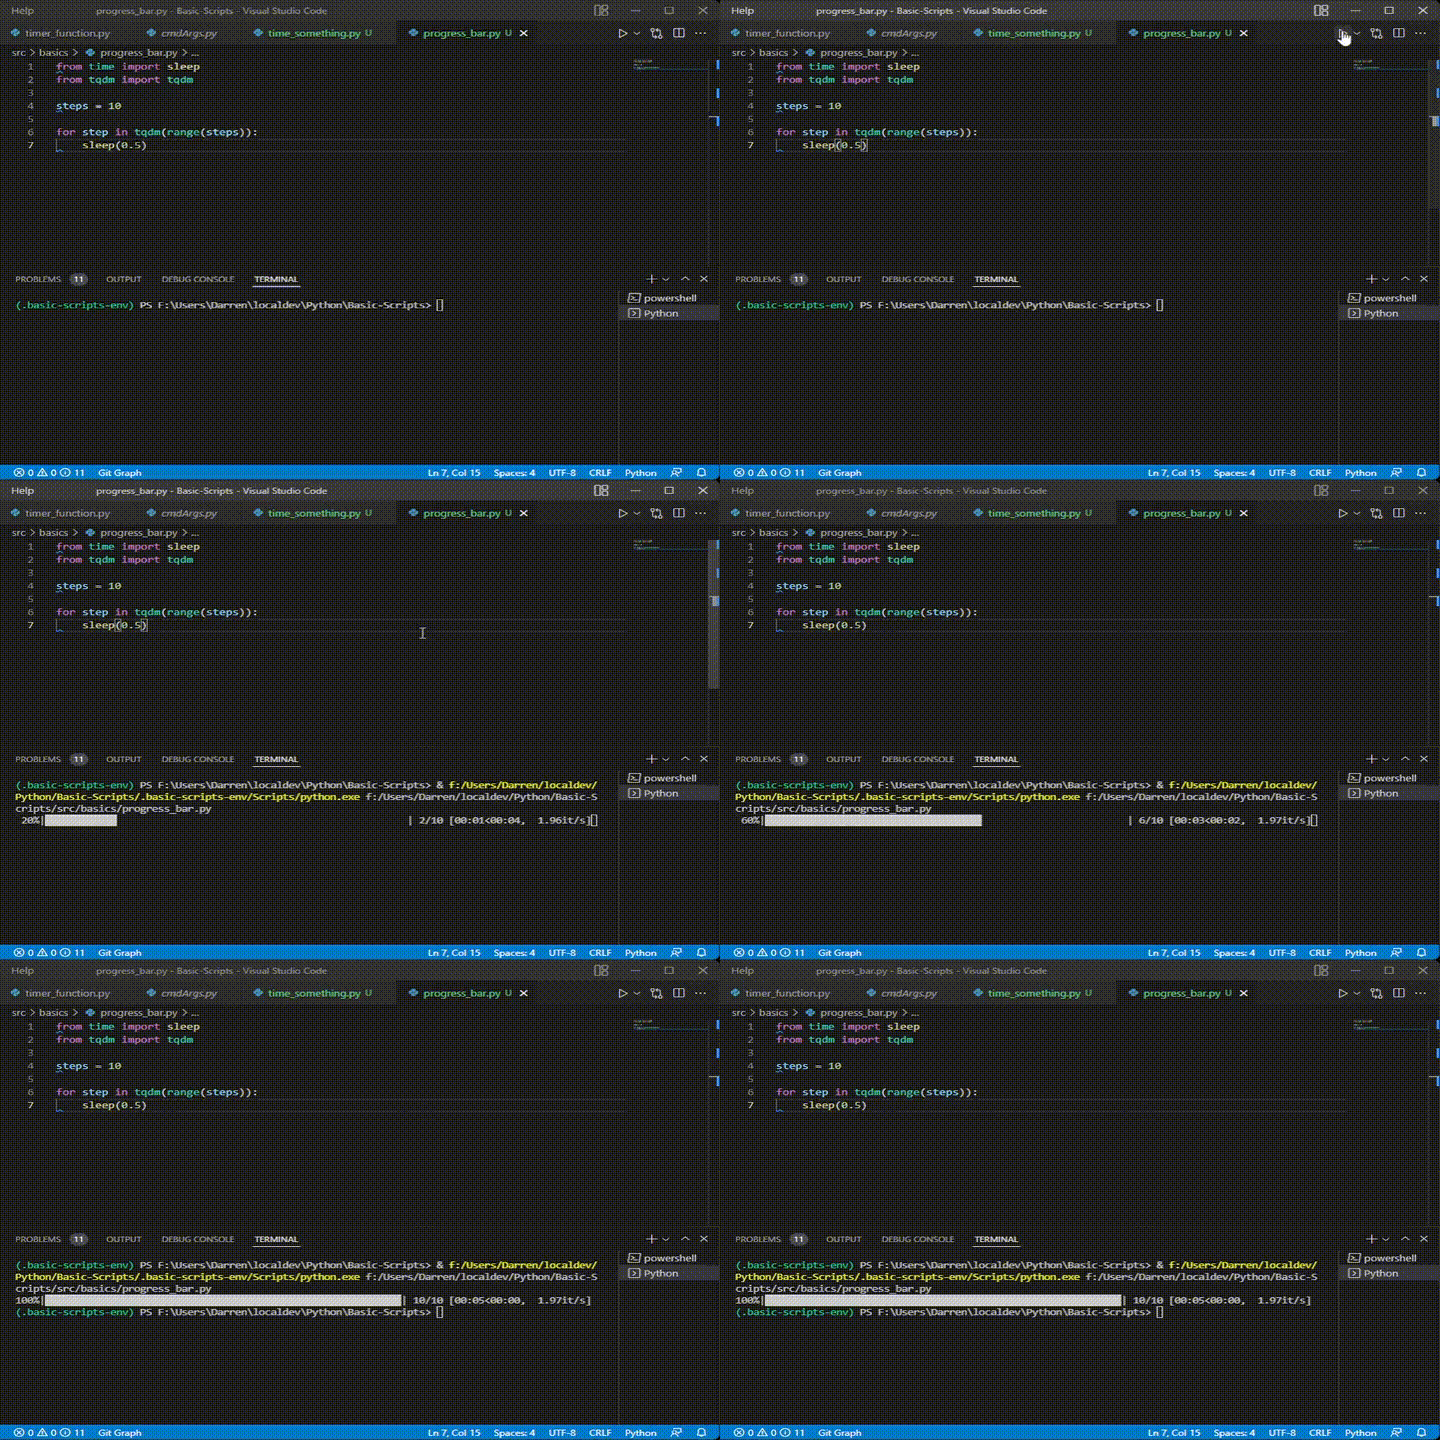
The tqdm package is a fantastic utility for displaying dynamic terminal progress bars. When working on a heavy algorithm (such as simulating millions of state transitions), tqdm provides real-time feedback on iteration speed, percent completed, and estimated time remaining.
To install tqdm into your managed environment using uv:
uv add tqdm
Wrap tqdm around any iterable:
from time import sleep
from tqdm import tqdm

steps = 10

for step in tqdm(range(steps)):
    sleep(0.5)
Examples
See how progress bars and timing can be applied in practice: