Learning Python with Advent of Code Walkthroughs
Dazbo's Advent of Code solutions, written in Python

Advent of Code 2021 - Day 9
Useful Links
Concepts and Packages Demonstrated
type hintinglintingBreadth First Search (BFS)lambda functionsfunctools reduceorthogonalassertPillow (PIL)
Contents
Problem Intro
This is a fairly straightforward problem, and an example of where we need to do a flood fill. It’s the first challenge in this year’s AoC that lends itself to a Breadth First Search (BFS). This is an extremely useful algorithm that comes in handy for a lot of BFS problems. It’s really worth understanding it!
We’re told we’re navigating underwater lava tubes. Hot smoke fills the caves and drifts to the floor. Our input is a heightmap, which looks like this:
2199943210
3987894921
9856789892
8767896789
9899965678
This is a 2D representation of the floor, which each digit being the height at that location.
Setup
import logging
import os
import time
from __future__ import annotations
from collections import deque
from dataclasses import dataclass
from functools import reduce
We’ve used most of this before. We’ll cover the new things as we come across them.
Part 1
Our goal is to find the sum of the risk of all the low points, where:
- a low point is a point where all adjacent points are higher**
- Risk level is given by
n+1, wherenis the height at that position.
I’ll start by creating a couple of useful classes. First, we’ll create a Point class, which is a dataclass. (We’ve used dataclasses before in this AoC.)
@dataclass(frozen=True)
class Point():
    ADJACENT_DELTAS = [(dx,dy) for dx in range(-1, 2)
                               for dy in range(-1, 2) if abs(dy) != abs(dx)]

    x: int
    y: int

    def yield_neighbours(self) -> Iterator[Point]:
        """ Yield adjacent (orthogonal) neighbour points """
        for vector in Point.ADJACENT_DELTAS:
            yield Point(self.x + vector[0], self.y + vector[1])
This Point dataclass has frozen=True, which makes it immutuble. An immutable object is one that can’t be changed after it is created.
The Point class stores its x and y positions, and knows how to yield every adjacent (orthogonal) location. It does this by storing the vectors (dx, dy) to get from itself to all adjacent Points. This list of delta vectors is created using a multi-sequence comprehension. I.e. a list comprehension that generates a single one-level list using nested for loops. By only returning dx,dy deltas where abs(dy) != abs(dx) we are excluding both diagonal deltas, as well as the delta 0,0. In short, it gives us this:
[(-1, 0), (0, -1), (0, 1), (1, 0)]
The Point class adds each of these deltas to itself, in order to create four new points. Here’s a quick demonstration to show what it’s actually doing:
point = Point(3,2)

for dx, dy in ADJACENT_DELTAS:
    adjacent_point = Point(point.x + dx, point.y + dy)
    print(adjacent_point)
Output:
Point(x=2, y=2)
Point(x=3, y=1)
Point(x=3, y=3)
Point(x=4, y=2)
Of special note is this line:
from __future__ import annotations
This tells Python to allow type hints using types that have not yet been defined. What does that mean? Well, type hints allow us to define which object types are expected as parameters to functions, and which object types will be returned by functions. If we do this and then try to pass the wrong object type to a function, or return the wrong object type from a function, then our Python linter will warn us about it.
Take this really simple example:
def inc(x):
    """ Increment the value of x by 1 """
    return x+1

inc("foo")
At this point, the code above is perfectly valid. Python won’t tell us there’s anything wrong with it. But it will clearly error at runtime, since we’re trying to increment the value of “foo” by 1. And that just doesn’t make any sense!

So, we can add type hints. Here, we’re telling Python that the input variable x should always be an int, and the return value from the function should also be an int.
def inc(x: int) -> int:
    """ Increment the value of x by 1 """
    return x+1

inc("foo")
And now, our Python linter warns us about the problem!
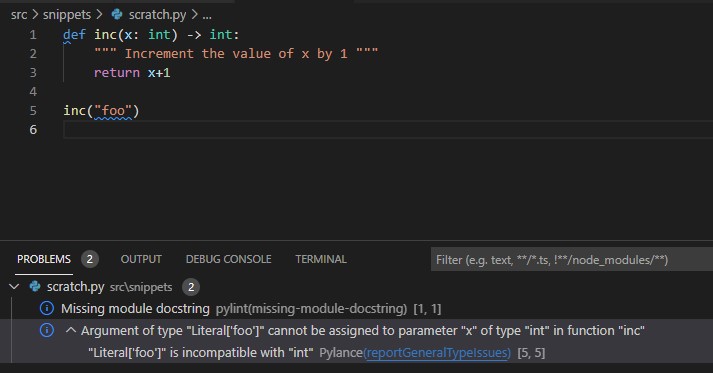
This is great, because we can catch issues before runtime.
So what’s all this got to do with annotations? Well, if we try to use type hints for a user-defined type has hasn’t been defined yet, the linter moans about.
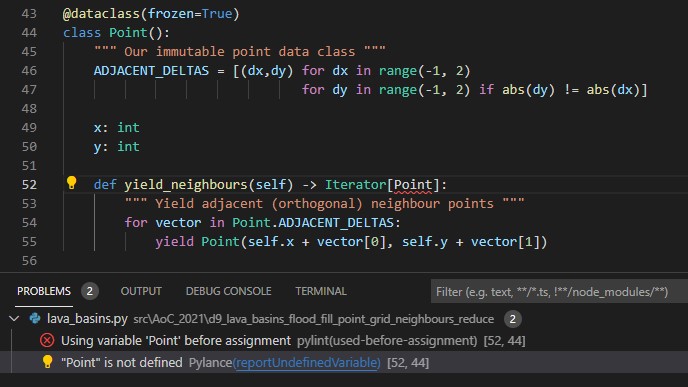
That’s because we’re type hinting using our Point class, but our Point class hasn’t been fully defined yet. We fix this using the annotations import.
Next, we’ll create a class that represents our input data as a Grid. It stores the list passed to the constructur. It then determines the width (length of the first row) and height (number of rows) of the list.
A note on the methods:
height_at_point(self, point)returns the value (height) for anyPointpassed to the method.risk_at_point(self, point)returns the risk for anyPointpassed to it, i.e. the height+1.low_points()creates asetto store all low points. Then it iterates through every location in the grid, creates aPointat that location, and then checks if thatPointis a low point by callingis_low_point(point).- The method
is_low_point(point)checks the value at thePointand the value of all adjacentPoints(that are part of the grid), and returnsTrueonly if the value for thisPointis lower than that of all the adjacentPoints. - Finally,
valid_location(point)simply checks if thePointpassed to it is actually within the bounds of our grid.
class Grid():
    def __init__(self, grid_array: list) -> None:
        self._array = grid_array
        self._width = len(self._array[0])
        self._height = len(self._array)

    def height_at_point(self, point: Point) -> int:
        """ Height is given by the value at this point """
        return self._array[point.y][point.x]

    def risk_at_point(self, point: Point) -> int:
        """ Risk is given by height at point + 1 """
        return self.height_at_point(point) + 1

    def low_points(self) -> set:
        """ Returns all low points in the grid """
        low_points = set()

        for y in range(self._height):
            for x in range(self._width):
                point = Point(x, y)
                if self.is_low_point(point):
                    low_points.add(point)

        return low_points

    def is_low_point(self, point: Point) -> bool:
        """ Determines if this point is a low point, i.e. surrounded by higher values. """
        value = self.height_at_point(point)

        for neighbour in point.yield_neighbours():
            if self.valid_location(neighbour):
                if self.height_at_point(neighbour) <= value:
                    return False

        return True

    def valid_location(self, point: Point) -> bool:
        """ Check if a location is within the grid """
        if (0 <= point.x < self._width and 0 <= point.y < self._height):
            return True

        return False
So now all we need to do is read the input data, split it into lines, and for each line, create a new list that stores the int value of each character. To do this, we’re using a nested list comprehension.
We then create our Grid from this parsed input data. We then get all the low points. Then, for each low point, we get its risk. Here, we’re using dictionary comprehension to create a dictionary of {point: risk} for each of the low points. We can then answer Part 1 by simply returning the sum of all the values of this dict.
input_file = os.path.join(SCRIPT_DIR, INPUT_FILE)
with open(input_file, mode="rt") as f:
    data = [[int(posn) for posn in row] for row in f.read().splitlines()]

grid = Grid(data)
low_points = grid.low_points()
risk_by_point = {point: grid.risk_at_point(point) for point in low_points}
logger.info("Part 1: low_point_risks = %d", sum(risk_by_point.values()))
Wow, I’ve written a lot, but we’ve done very little!
Part 2
We’re asked to find the three largest basins, where a basin is any location that flows down to a low point. Locations of height 9 do not count as a basin, and it turns out that all basins in the data are bounded by a circumference of 9s.
The size of a basin is the count of all locations within in (excluding the 9s).
Breadth First Search to the rescue! LEARN THIS ALGORITHM!
It works like this:
- Create an expanding perimeter called the frontier. (We’ll typically some sort of queue for this.) It starts off empty.
- Create a set to store points we’ve discovered.
- Add our starting point to the frontier. In this case, one of our low points. Also add it to our disovered set.
- Now, for as long as there are locations on the frontier:
- Pop the next point from the frontier.
- Find all adjacent (valid) locations to this point. Add them to frontier, and add them to the discovered set.
This approach, when used to discover an area from a starting point, is often called a flood fill.
So how do we implement this to solve Part 2? Easy… Just add this method to our Grid class:
def get_basin(self, low_point: Point) -> set:
    """ Given a low point, determine all the surrounding points that make up a basin.
    Any points with height 9 mark the boundary of the basin and are NOT part of the basin. """

    assert self.is_low_point(low_point), "We should never start with a point that isn't a low point"

    basin_points = set()            # The points we'll return
    points_to_assess: deque[Point] = deque()  # Points we want to get value of, and get neighbours for
    assessed = set()                # Points we don't want to assess again
    points_to_assess.append(low_point)  # where we start

    while points_to_assess:     # They should only ever be valid points
        point_to_assess = points_to_assess.popleft()
        if point_to_assess in assessed:
            continue    # We've seen this before, so skip it

        assessed.add(point_to_assess)   # So we don't look at this again

        if self.height_at_point(point_to_assess) < 9:   # Points lower than 9 count as basin
            basin_points.add(point_to_assess)

            for neighbour in point_to_assess.yield_neighbours():
                if self.valid_location(neighbour):
                    if neighbour not in assessed:   # We will need to assess this point
                        points_to_assess.append(neighbour)

    return basin_points
Our method does this:
- First, we
assertthat we’re starting with one of the low points we found previously. Assert is really useful for checking the logic in our code. It’s not designed for input validation, but it is used to check that that a condition we assume to always be true is actually true. If the assertion fails, the program immediately terminates with anAssertionError. - Then we create the
basin_pointsset, to store all the discovered points in our basin. - Then we create our frontier, which is called
points_to_assess. I’m using adequeto implement our frontier, such that I can process locations in FIFO (first in, first out) order. (Though, since we actually need to discover every point in the basin, the order we process the points doesn’t actually matter.) - Then we add our starting point (the low point) to the frontier and to
basin_points. - Then we loop:
- Pop the next location off the front of the frontier queue.
- If this location is already in
basin_points, skip it. - Otherwise:
- Add the location to
basin_points. - Get the neighbours of this location, where the height is less than 9. (Since points at height 9 mark the boundary of the basin.) Add these to the frontier.
- Add the location to
Once we’ve discovered all the locations in the basin, the frontier will be empty.
Finally, to use our new method and solve Part 2, we:
- Call our
get_basin(point)method for each of the low points we discovered in Part 1. - Store the size of each basin in a list.
- Sort this list of sizes into size order, with biggest first.
- Use a
sliceon thelist, to return only the first three items, and store asbiggest_basins. - Iterate through each item in
biggest_bains, and multiply it by the next item. We use alambdafunction, along withitertools.reduce(), to achieve this.
basin_sizes = []
for point in low_points:    # basins are generated from low points
    basin = grid.get_basin(point)
    basin_sizes.append(len(basin))

qty_required = 3
basin_sizes.sort(reverse=True)  # descending size order
biggest_basins = basin_sizes[0:qty_required]  # top n basins
logger.info("Part 2: product = %d", reduce((lambda x, y: x * y), biggest_basins))
The output looks something like this:
2022-01-15 14:07:02.989:INFO:__main__:  Part 1: low_point_risks = 417
2022-01-15 14:07:03.027:INFO:__main__:  Part 2: product = 1148965
2022-01-15 14:07:03.028:INFO:__main__:  Execution time: 0.0675 seconds
Wrap Up
This wasn’t a particularly tough challenge, since it’s pretty obvious how to solve it, and the techniques are fairly standard. However, we did introduce a lot of new concepts today.
How about some visualisation?
Just for fun, let’s render the cave height map as an image. This is pretty easy to do with the Python Imagining Library (PIL). First we need to install Pillow.
py -m pip install Pillow
Here are the code changes…
First:
- Import from PIL.
- Store a boolean that turns on or off the image rendering, as required.
- Decide where we want to put the generated image file.
from PIL import Image

...

RENDER = True
OUTPUT_FILE = os.path.join(SCRIPT_DIR, "output/heatmap.png")
Now we’ll add a render_iamge() method to our Grid class:
def render_image(self, target_width:int=600) -> Image.Image:
    """ Render grid as a heatmap image

    Args:
        width (int, optional): Target width, in pxiels. Defaults to 600.
    """
    scale = target_width // self._width  # our original image is only a few pixels across. We need to scale up.

    # Flatten our x,y array into a single list of height values
    height_values = [self.height_at_point(Point(x,y)) for y in range(self._height)
                                                      for x in range(self._width)]
    max_height = max(height_values)

    # create a new list of RGB values, where each is given by an (R,G,B) tuple.
    # To achieve a yellow->amber->red effect
    # we want R to always be 255, B to always be 0, and G to vary based on height
    pixel_colour_map = list(map(lambda x: (255, int(255*((max_height-x)/max_height)), 0), height_values))

    image = Image.new(mode='RGB', size=(self._width, self._height))
    image.putdata(pixel_colour_map)  # load our colour map into the image

    # scale the image and return it
    return image.resize((self._width*scale, self._height*scale), Image.NEAREST)
This is what it does:
- Take our 2D grid, and convert it to a single flattened list of int values, which are the heights at each location. I.e. all the values from the first row, then all the values from the second row, and so on.
- Create an RGB pixel map, by convert each single height value (which is always going to be in the range 0-9) to an RGB tuple, which is always (255, x, 0). The value of x is dependent on the height.
- Create a new PIL
Imageobject, by loading in our pixel map. - Finally, resize the pixel map to something big enough to see!
Lastly, we just need to save the Image as a file. If the parent directory of the file doesn’t exist, then create it:
if RENDER:
    dir_path = os.path.dirname(OUTPUT_FILE)
    if not os.path.exists(dir_path):
        os.makedirs(dir_path)
    image = grid.render_image(400)
    image.save(OUTPUT_FILE)
With the sample data, we end up with an image file that looks like this:

And with the actual data, something like this:
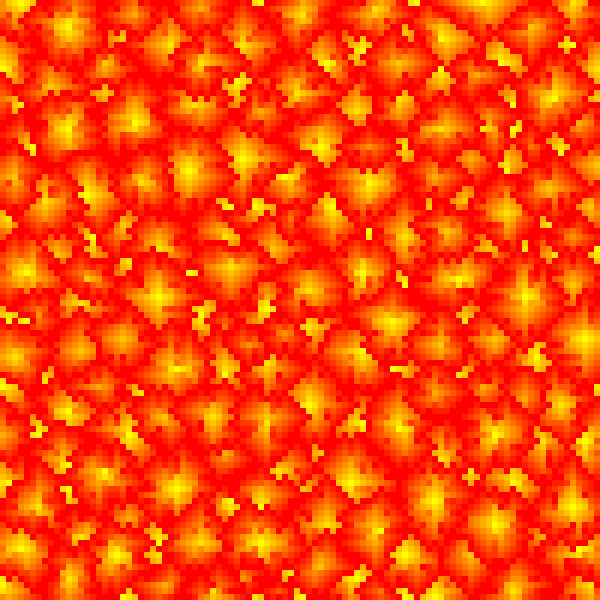
Cool, right?