
Problem Intro
OMG! It’s Christmas day.
It was a relief that this problem was easy to solve. I’ve got presents to open!! I say easy… Not completely trivial, and there is at least one gotcha.
Overview
We need to land our sub on the seafloor. But the seafloor is covered in sea cucumbers. Specifically, there are two herds of cucumbers:
- One herd is migrating directly east,
>. - One herd is migrating directly south,
v.
Our input data is map of the starting locations of these migrating sea cucumbers. E.g.
v...>>.vv>
.vv>>.vv..
>>.>v>...v
>>v>>.>.v.
v>v.vv.v..
>.>>..v...
.vv..>.>v.
v.v..>>v.v
....v..v.>
The grid uses . to denote empty spaces.
The migration rules:
- With each step:
- All the cucumbers of the east herd migrate - simultaneously - one step, if they’re not blocked. Because they all move simultaneoulsy, only consider whether they’re blocked before they all move. For this reason, if we take this row:
v...>>.vv>
The next position after east migration is:v...>.>vv>
The next position after east migration is not:v....>>vv> - Then, all the cucumbers of the south herd migrate - simultaneously - one step, if they’re not blocked.
- All the cucumbers of the east herd migrate - simultaneously - one step, if they’re not blocked. Because they all move simultaneoulsy, only consider whether they’re blocked before they all move. For this reason, if we take this row:
- If a cucumber migrates off the right edge or bottom edge, they miraculously reappear on the opposite edge.
Part 1
What is the first step on which no sea cucumbers move?
The cucumbers will stop moving when they’re all blocked.
I’ll create a Grid class, that represents all the sea cucumber locations, and can simulate their movement with each step:
class Grid():
    """ Store locations of sea cucumbers. """

    def __init__(self, data: list[str]) -> None:
        """ Take input data and convert from list-of-str to list-of-list for easier manipulation. """
        self._grid = [list(row) for row in data]    # Now a nested list of list.
        self._row_len = len(self._grid[0])
        self._grid_len = len(self._grid)
        self._changed_last_cycle = True

    @property
    def changed_last_cycle(self):
        return self._changed_last_cycle

    def cycle(self):
        """ Performs a migration cycle for our east-moving and south-moving herds
        Performs all east, and then performs all south. Then updates the grid. """
        self._changed_last_cycle = False

        # Make a copy of the grid.  Shallow copy won't work, as we have a nested list. Deepcopy is too slow.
        tmp_grid = [[self._grid[y][x] for x in range(self._row_len)] for y in range(self._grid_len)]

        # process east herd, row by row
        for y in range(self._grid_len):
            for x in range(self._row_len):
                next_x = (x+1)%self._row_len  # get right / wrap-around
                if self._grid[y][x] + self._grid[y][next_x] == ">.":
                    tmp_grid[y][x] = "."
                    tmp_grid[y][next_x] = ">"
                    self._changed_last_cycle = True

        self._grid = tmp_grid

        east_migrated = [[tmp_grid[y][x] for x in range(self._row_len)] for y in range(self._grid_len)]

        for y in range(self._grid_len):
            for x in range(self._row_len):
                next_y = (y+1)%self._grid_len  # get below / wrap-around
                if tmp_grid[y][x] + tmp_grid[next_y][x] == "v.":
                    east_migrated[y][x] = "."
                    east_migrated[next_y][x] = "v"
                    self._changed_last_cycle = True

        self._grid = east_migrated

    def __repr__(self) -> str:
        return "\n".join("".join(char for char in row) for row in self._grid)
This is how it works:
- Take the input data - as a
listofstr- convert it to alistoflists, and store in the instance variable_grid. - Determine
_row_lenfrom the length of the first row. - Determine
_grid_lenfrom the number of rows in the grid. - Expose whether the grid changed in the last cycle, through the
propertycalledchanged_last_cycle. - All the work is done in the
cycle()method, which is exposed by the class:- First, set
_changed_last_cycletoFalse. - Now make a copy of the current grid. We do this using nested
list comprehension, which is much faster than using thedeepcopy()method. We need a copy, because we always need to evaluate each existing cucumber positions based on the grid configuration at the start of the cycle; but we need to be updating the new configuration one cucumber at a time. - Now iterate through each row.
- Iterate through each character position in the row, from left to right.
- We note that the current horizontal cucumber position is given by
x, and the next horizontal cucumber position is given bynext_x. Crucially,next_xis equivalent to(x+1) % row_len, to allow for the next position wrapping over to the left. - Then we look for all
">.", since these represent location pairs where a cucumber can migrate one space to the east. Wherever we find this:- Set these two characters to be
".>"in the new copy. - Set
_changed_last_cycletoTrue.
- Set these two characters to be
- We note that the current horizontal cucumber position is given by
- Iterate through each character position in the row, from left to right.
- Once we exit the above loop, east migration has completed. So make a new copy of the current state of the herds.
- As above, iterate through each row.
- Iterate through horizontal cucumber positions.
- This time compute the next
yposition, allowing for the next position to roll around back to the top. - Now look for
"v."at each horizontal position, across pairs of rows. If we find any:- Change to
".v"in the new copy. - Set
_changed_last_cycletoTrue.
- Change to
- This time compute the next
- Iterate through horizontal cucumber positions.
- All migration has now completed. Update the Grid’s
_gridattribute to reflect the current state.
- First, set
Now we just need to read in the data, construct a Grid class from it, then cycle our Grid until there are no more changes:
with open(INPUT_FILE, mode="rt") as f:
    data = f.read().splitlines()

grid = Grid(data)

i = 0
while grid.changed_last_cycle:
    i += 1
    grid.cycle()

logger.info("We've stopped migrating at iteration %d", i)
It works!! Hurrah!
22:57:03.946:DEBUG:__main__:    Created Grid
22:57:06.336:INFO:__main__:     We've stopped migrating at iteration 360
22:57:06.336:INFO:__main__:     Execution time: 2.3969 seconds
Part 2
There’s nothing to do. Turns out we’ve saved Christmas!!
Woop, woop!!
Visualisation
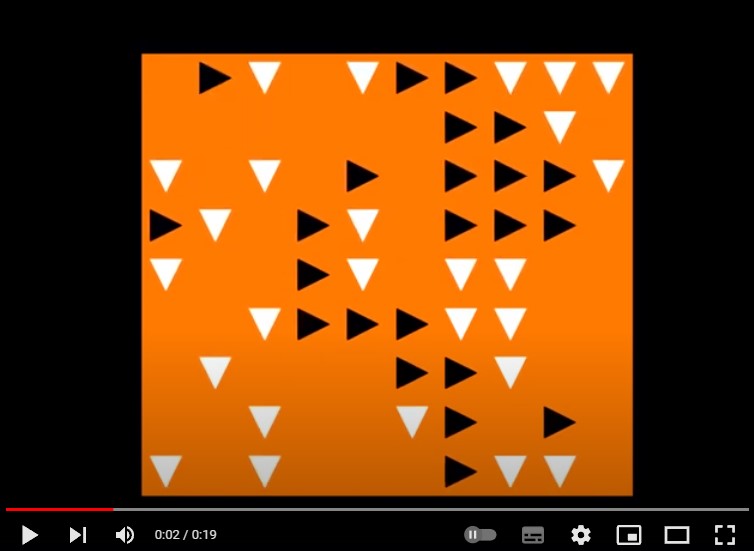
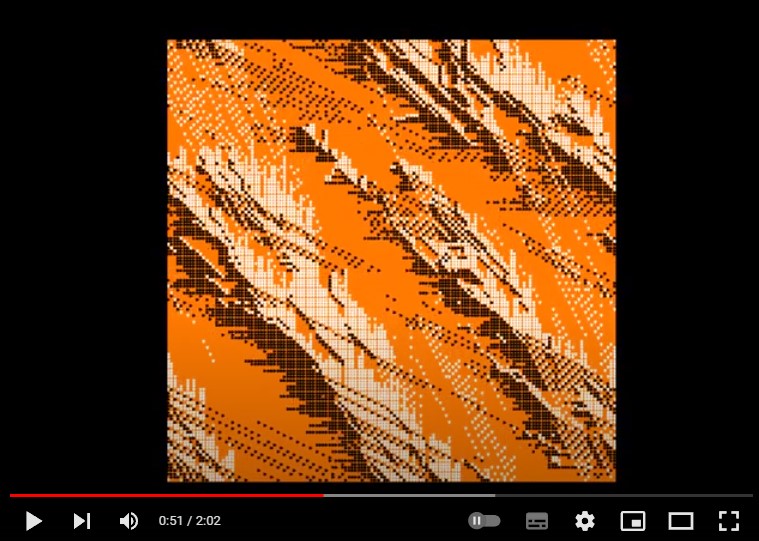
It would be great to build an animation to visualise our migrating sea cucumber herds. Here’s my strategy for building the animation:
- For each cycle:
- Use Matplotlib to plot the cucumber positions on the grid, in the form of a pretty scatter plot.
- Save one frame for the east migration, and another frame for the south migration.
- Finally, use ImageIO to assemble all the frames into a single animation gif file.
Here’s our modified Grid class:
class Grid():
    """ Store locations of sea cucumbers. """

    def __init__(self, data: list[str], animator: Animator=None) -> None:
        """ Take input data and convert from list-of-str to list-of-list for easier manipulation. """
        init_str = "Created Grid"
        if animator:
            init_str += " with Animator"
        logger.debug(init_str)

        self._grid = [list(row) for row in data]    # Now a nested list of list.
        self._row_len = len(self._grid[0])
        self._grid_len = len(self._grid)
        self._changed_last_cycle = True

        self._animator = animator
        self._plot_info = self.setup_fig()  # does no work if no Animator
        self._render_frame()

    @property
    def changed_last_cycle(self):
        return self._changed_last_cycle

    def cycle(self):
        """ Performs a migration cycle for our east-moving and south-moving herds
        Performs all east, and then performs all south. Then updates the grid. """
        self._changed_last_cycle = False

        # Make a copy of the grid.  Shallow copy won't work, as we have a nested list. Deepcopy is too slow.
        tmp_grid = [[self._grid[y][x] for x in range(self._row_len)] for y in range(self._grid_len)]

        # process east herd, row by row
        for y in range(self._grid_len):
            for x in range(self._row_len):
                next_x = (x+1)%self._row_len  # get right / wrap-around
                if self._grid[y][x] + self._grid[y][next_x] == ">.":
                    tmp_grid[y][x] = "."
                    tmp_grid[y][next_x] = ">"
                    self._changed_last_cycle = True

        self._grid = tmp_grid
        self._render_frame()

        east_migrated = [[tmp_grid[y][x] for x in range(self._row_len)] for y in range(self._grid_len)]

        for y in range(self._grid_len):
            for x in range(self._row_len):
                next_y = (y+1)%self._grid_len  # get below / wrap-around
                if tmp_grid[y][x] + tmp_grid[next_y][x] == "v.":
                    east_migrated[y][x] = "."
                    east_migrated[next_y][x] = "v"
                    self._changed_last_cycle = True

        self._grid = east_migrated
        self._render_frame()

    def __repr__(self) -> str:
        return "\n".join("".join(char for char in row) for row in self._grid)

    def _render_frame(self):
        """ Only renders an animation frame if we've attached an Animator """
        if not self._animator:
            return

        east = set()
        south = set()

        for y in range(self._grid_len):
            for x in range(self._row_len):
                if self._grid[y][x] == ">":
                    east.add((x,y))
                elif self._grid[y][x] == "v":
                    south.add((x,y))

        east_x, east_y = zip(*east)
        south_x, south_y = zip(*south)

        axes, mkr_size = self._plot_info

        axes.clear()
        min_x, max_x = -0.5, self._row_len - 0.5
        min_y, max_y = -0.5, self._grid_len - 0.5
        axes.set_xlim(min_x, max_x)
        axes.set_ylim(max_y, min_y)

        axes.scatter(east_x, east_y, marker=">", s=mkr_size, color="black")
        axes.scatter(south_x, south_y, marker="v", s=mkr_size, color="white")

        # save the plot as a frame; store the frame in-memory, using a BytesIO buffer
        frame = BytesIO()
        plt.savefig(frame, format='png') # save to memory, rather than file
        self._animator.add_frame(frame)

    def setup_fig(self):
        if not self._animator:
            return

        my_dpi = 120
        fig, axes = plt.subplots(figsize=(1024/my_dpi, 768/my_dpi), dpi=my_dpi, facecolor="black") # set size in pixels
        axes.get_xaxis().set_visible(False)
        axes.get_yaxis().set_visible(False)
        axes.set_aspect('equal') # set x and y to equal aspect
        axes.set_facecolor('xkcd:orange')

        min_x, max_x = -0.5, self._row_len - 0.5
        min_y, max_y = -0.5, self._grid_len - 0.5
        axes.set_xlim(min_x, max_x)
        axes.set_ylim(max_y, min_y)

        # dynamically compute the marker size
        fig.canvas.draw()
        mkr_size = ((axes.get_window_extent().width / (max_x-min_x) * (45/fig.dpi)) ** 2)
        return axes, mkr_size
- Changes to the
__init__()method:- It now takes a new optional argument, called
animator.- If we pass an
Animatorobject, then we’ll render the animation.- We’ll store it in the Grid’s
_animatorinstance variable. - We call
setup_fig()to do some initialisation for Matplotlib. - We generate an initial frame, to represent the initial state of the
Grid.
- We’ll store it in the Grid’s
- If we pass an
- It now takes a new optional argument, called
- Changes to the
cycle()method:- This now calls
_render_frame()at the end of the east migration, and at the end of the south migration. Thus, adding two new frames per cycle.
- This now calls
- The new
setup_fig()method:- Establishes the size of the plot, in pixels. This will be the size of our rendered frames, e.g. 1024x768 pixels.
- Hides the x and y axes.
- Sets the face colour of the plot to orange.
- Sets the x and y axis limits to be an extra 0.5 outside the grid. E.g. if the x axis went from 0 to 10, then this would set the limits to be -0.5 and 10.5
- We then dynamically compute a marker size, which we’ll use to represent each sea cucumber. The bigger the grid in the input data, the smaller the marker size will be.
- The new
_render_frame()method:- Is private to the
Gridclass. - If our
Gridhas noAnimator, then this method immediately returns. Else… - Store
(x,y)tuples for each east cucumber in aneastset. - Store
(x,y)tuples for each south cucumber in asouthset. - Use
zip()to turn each set of(x,y)tuples in a tuple of allxvalues, and a tuple of allyvalues. (Matplotlib needs the coordinates to be passed in this format.) - Plot the scatters:
- Using black
>markers for the east cucumbers. - Using white
vmarkets for the south cucumbers.
- Using black
- Now we can use
plt.savefig()to save our plot as a file. My first version of this animation actually saved each frame as a file, requiring me to stich the frames together, and then delete these temporary files. But instead, we can save to an in-memory BytesIO object; essentially, an in-memory file. This turns out to be an order of magnitude faster, even though I was writing my temporary files to an SSD.
- Is private to the
Then I created an Animator class, to do the job of storing our frames, and then stiching them together as an animation gif:
class Animator():
    """ Creates an animation file of specified target size. """

    def __init__(self, file: Path, fps: int, loop=1) -> None:
        """ Create an Animator. Suggest the file should be a .gif.
        Set frames per second (fps).
        Set loop to 0, to loop indefinitely. Default is 1. """
        self._outputfile = file
        self._frames = []  # can be in-memory BytesIO objects, or files
        self._fps = fps
        self._loop = loop

        dir_path = Path(self._outputfile).parent
        if not Path.exists(dir_path):
            Path.mkdir(dir_path)

    def save_anim(self):
        """ Takes animation frames, and converts to a single animated file. """
        logger.debug("Saving animation...")
        with imageio.get_writer(self._outputfile, mode='I', fps=self._fps, loop=self._loop) as writer:
            for frame in tqdm(self._frames):
                image = imageio.imread(frame)
                writer.append_data(image)

        logger.info("Animation saved to %s", self._outputfile)

    def add_frame(self, frame):
        """ Add a frame to the animation.
        The frame can be in the form of a BytesIO object, or a file Path
        """
        self._frames.append(frame)
Some things to note about this class:
- The
__init__()is passed an output file, as well as the desired frames per second in the animation.- This method takes care of creating the output folder, if it doesn’t yet exist.
- The
add_frame()method is called by our Grid’s_render_frame()method. We can pass in a path to an actual file, or we can pass an BytesIO object. - The
save_anim()method converts our set of frames to a single animation gif file.- It does this by using imageio to read each file / BytesIO object, and then appending it to the
writercontext manager. - As I’ve done with several AoC challenges this year, I’ve wrapped the
forloop that creates the animation withtqdm, in order to generate a progress bar. That’s because generating the animation with 360 cycles (and thus 721 frames) takes 20 seconds or so. So I wanted some sort of visual feedback.
- It does this by using imageio to read each file / BytesIO object, and then appending it to the
And here’s what these animations look like:
Sample Data
Actual Data
And We’re Done!
Well, that was a touch AoC. Tougher than any I’ve done before.
I hope you found these walkthroughs useful. I’ve really enjoyed creating them.
If you want to get in touch, e.g. to offer any feedback, find me through my GitHub Profile.